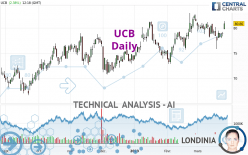
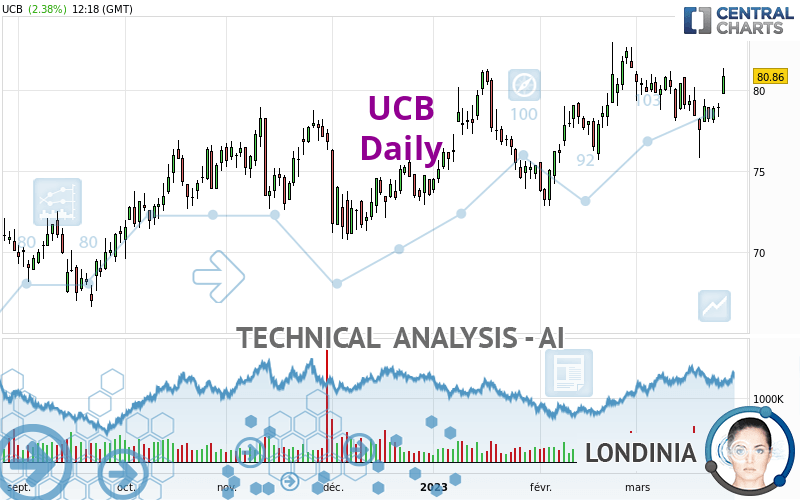
UCB - Daily - Technical analysis published on 03/27/2023 (GMT)
- 105
- 0
Click here for a new analysis!
- Timeframe : Daily
- - Analysis generated on
- Status : TARGET REACHED
Summary of the analysis

Additional analysis
Quotes
The UCB rating is 80.86 EUR. On the day, this instrument gained +2.38% and was traded between 79.78 EUR and 81.40 EUR over the period. The price is currently at +1.35% from its lowest and -0.66% from its highest.The Central Gaps scanner detects the formation of a bullish gap marking the strong presence of buyers against sellers at the opening. This formed a quotation gap.
Opening Gap UP
Type : Bullish
Timeframe : Openning
A study of price movements over other periods shows the following variations:
Near a new HIGH record (1st january)
Type : Bullish
Timeframe : Weekly
Near a new LOW record (1 month)
Type : Bearish
Timeframe : Weekly
Technical
A technical analysis in Daily of this UCB chart shows a strongly bullish trend. The signals given by moving averages are 82.14% bullish. This strongly bullish trend seems to be running out of steam given the signals being given by short-term moving averages. An assessment of moving averages reveals several bearish and bullish signals:
Bearish trend reversal : Moving Average 50
Type : Bearish
Timeframe : Daily
Bullish price crossover with Moving Average 20
Type : Bullish
Timeframe : Daily
The technical indicators are bullish. There is still some doubt about the price increase.
But beware of excesses. The Central Indicators scanner currently detects this:
Williams %R indicator is overbought : over -20
Type : Neutral
Timeframe : Daily
Pivot points : price is over resistance 1
Type : Neutral
Timeframe : Weekly
Pivot points : price is over resistance 3
Type : Neutral
Timeframe : Daily
RSI indicator is back over 50
Type : Bullish
Timeframe : Daily
Parabolic SAR indicator bullish reversal
Type : Bullish
Timeframe : Daily
Aroon indicator bullish trend
Type : Bullish
Timeframe : Daily
MACD indicator is back over 0
Type : Bullish
Timeframe : Daily
Momentum indicator is back over 0
Type : Bullish
Timeframe : Daily
Central Patterns, the market scanner focusing on chart patterns, resistances and supports found these results:
Near resistance of channel
Type : Bearish
Timeframe : Daily
Near resistance of triangle
Type : Bearish
Timeframe : Daily
For a small rebound in the very short term, the Central Candlesticks scanner currently notes the presence of this bullish pattern in Japanese candlesticks:
Upside gap
Type : Bullish
Timeframe : Daily
| S3 | S2 | S1 | Price | R1 | R2 | R3 | |
|---|---|---|---|---|---|---|---|
| ProTrendLines | 73.29 | 76.35 | 78.26 | 80.86 | 81.16 | 86.58 | 88.38 |
| Change (%) | -9.36% | -5.58% | -3.22% | - | +0.37% | +7.07% | +9.30% |
| Change | -7.57 | -4.51 | -2.60 | - | +0.30 | +5.72 | +7.52 |
| Level | Intermediate | Major | Intermediate | - | Major | Minor | Intermediate |
To determine price objectives, it is also possible to use the pivot points. Here is the price position in relation to pivot points:
| Pivot points | S3 | S2 | S1 | PP | R1 | R2 | R3 |
|---|---|---|---|---|---|---|---|
| Standard | 77.66 | 78.02 | 78.50 | 78.86 | 79.34 | 79.70 | 80.18 |
| Camarilla | 78.75 | 78.83 | 78.90 | 78.98 | 79.06 | 79.13 | 79.21 |
| Woodie | 77.72 | 78.05 | 78.56 | 78.89 | 79.40 | 79.73 | 80.24 |
| Fibonacci | 78.02 | 78.34 | 78.54 | 78.86 | 79.18 | 79.38 | 79.70 |
| Pivot points | S3 | S2 | S1 | PP | R1 | R2 | R3 |
|---|---|---|---|---|---|---|---|
| Standard | 73.07 | 74.43 | 76.71 | 78.07 | 80.35 | 81.71 | 83.99 |
| Camarilla | 77.98 | 78.31 | 78.65 | 78.98 | 79.31 | 79.65 | 79.98 |
| Woodie | 73.52 | 74.66 | 77.16 | 78.30 | 80.80 | 81.94 | 84.44 |
| Fibonacci | 74.43 | 75.82 | 76.68 | 78.07 | 79.46 | 80.32 | 81.71 |
| Pivot points | S3 | S2 | S1 | PP | R1 | R2 | R3 |
|---|---|---|---|---|---|---|---|
| Standard | 65.01 | 68.93 | 75.15 | 79.07 | 85.29 | 89.21 | 95.43 |
| Camarilla | 78.59 | 79.52 | 80.45 | 81.38 | 82.31 | 83.24 | 84.17 |
| Woodie | 66.17 | 69.51 | 76.31 | 79.65 | 86.45 | 89.79 | 96.59 |
| Fibonacci | 68.93 | 72.80 | 75.19 | 79.07 | 82.94 | 85.33 | 89.21 |
Numerical data
The following is the status of the technical indicators and moving averages at the time of publication of this technical analysis:
| RSI (14): | 56.95 | |
| MACD (12,26,9): | 0.1400 | |
| Directional Movement: | 8.61 | |
| AROON (14): | 35.71 | |
| DEMA (21): | 79.56 | |
| Parabolic SAR (0,02-0,02-0,2): | 75.80 | |
| Elder Ray (13): | 1.29 | |
| Super Trend (3,10): | 76.82 | |
| Zig ZAG (10): | 80.80 | |
| VORTEX (21): | 0.9400 | |
| Stochastique (14,3,5): | 68.55 | |
| TEMA (21): | 79.15 | |
| Williams %R (14): | -10.71 | |
| Chande Momentum Oscillator (20): | -0.02 | |
| Repulse (5,40,3): | 1.7000 | |
| ROCnROLL: | 1 | |
| TRIX (15,9): | 0.0400 | |
| Courbe Coppock: | 3.38 |
| MA7: | 78.84 | |
| MA20: | 79.63 | |
| MA50: | 78.32 | |
| MA100: | 76.73 | |
| MAexp7: | 79.33 | |
| MAexp20: | 79.27 | |
| MAexp50: | 78.46 | |
| MAexp100: | 77.79 | |
| Price / MA7: | +2.56% | |
| Price / MA20: | +1.54% | |
| Price / MA50: | +3.24% | |
| Price / MA100: | +5.38% | |
| Price / MAexp7: | +1.93% | |
| Price / MAexp20: | +2.01% | |
| Price / MAexp50: | +3.06% | |
| Price / MAexp100: | +3.95% |
News
The latest news and videos published on UCB at the time of the analysis were as follows:
- Bimekizumab Phase 3 Data in Hidradenitis Suppurativa Show Clinically Meaningful, Deep and Maintained Response over 48 Weeks
- UCB to Present Eight Bimekizumab Abstracts at AAD 2023 with Results from Studies in Psoriasis, Psoriatic Arthritis, and Hidradenitis Suppurativa
- Annals of the Rheumatic Diseases Publishes Results from Two Bimekizumab Phase 3 Studies in Axial Spondyloarthritis
- UCB announces rozanolixizumab BLA for the treatment of generalized myasthenia gravis filed with U.S. FDA and designated for Priority Review
- UCB Announces Positive Phase 3 Studies for Bimekizumab in Hidradenitis Suppurativa
About author
Online


Add a comment
Comments
0 comments on the analysis UCB - Daily