UNITED BANKSHARES INC. - Daily - Technical analysis published on 10/11/2019 (GMT)
- Who voted?
- 157
- 0
- Timeframe : Daily
- - Analysis generated on
- Status : NEUTRAL
Summary of the analysis
Trends
Court terme:
Bearish
De fond:
Slightly bullish
Technical indicators
22%
39%
39%
My opinion
Neutral between 36.98 USD and 37.40 USD
My targets
-
My analysis
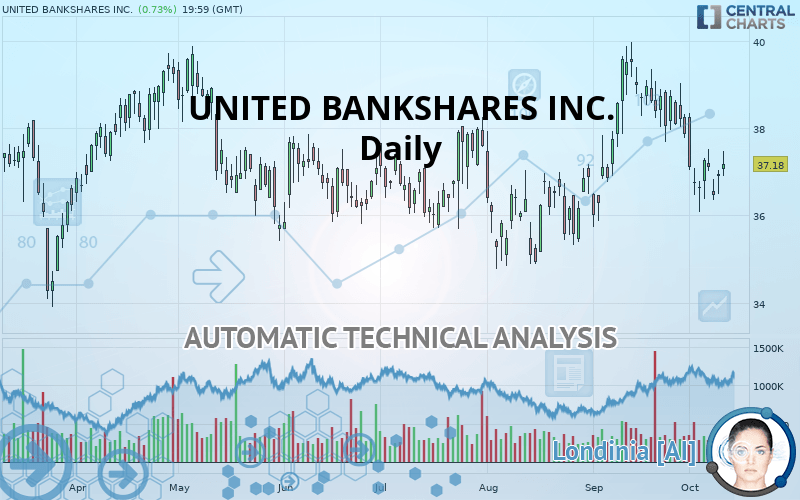
The basic trend is slightly bullish and the short term is tentatively bearish. With such a pattern, the price could just as easily move towards the first support as the first resistance. The first support is located at 36.98 USD. The first resistance is located at 37.40 USD. With no basic trend, it will be important to monitor the reaction of the price to the levels cited. A bearish break in the support could quickly reverse the basic trend. A bullish break in resistance would be welcome to boost the slightly bullish basic trend. On the other hand, if the price is blocked by support or resistance, it could be attractive to trade against the trend on the last short-term movement registered by UNITED BANKSHARES INC..
Technical indicators are neutral in the very short term and are not able to influence the opinion of this analysis.
Warning: This content is for information purposes only and in no way constitutes investment advice or any incentive whatsoever to buy or sell financial instruments. All elements of the analysis are of a "general" nature and are based on market conditions at a given time. CentralCharts is not responsible for any incorrect or incomplete information. Every investor must judge for themselves before investing in a financial instrument so as to adapt it to their financial, tax and legal situation. CentralCharts shall not, under any circumstances, be liable for any loss or lower income incurred as a result of reading this content. Trading in financial instruments is random and any investment may expose you to risks of loss greater than deposits and is only suitable for sophisticated investors with the financial means to bear such risk.

This analysis was given by Vincent Launay. Take part yourself by sharing additional analysis on another time unit:
Additional analysis
Quotes
The UNITED BANKSHARES INC. price is 37.18 USD. On the day, this instrument gained +0.73% and was between 36.91 USD and 37.48 USD. This implies that the price is at +0.73% from its lowest and at -0.80% from its highest.36.91
37.48
37.18
A bullish gap was detected at the opening by the Central Gaps scanner. There are a lot of buyers and they have the upper hand in the very short term.
Opening Gap UP
Type : Bullish
Timeframe : Openning
So that you have an overall view of the price change, here is a table showing the variations over several periods:
Near a new LOW record (1 month)
Type : Bearish
Timeframe : Weekly
Technical
Technical analysis of UNITED BANKSHARES INC. in Daily shows an overall slightly bullish trend. 53.57% of the signals given by moving averages are bullish. Caution: the slightly bearish signals currently given by short-term moving averages indicate that the overall trend could be reversed. There is no crossing of moving average by the price or crossing of moving averages between themselves.
The technical indicators are generally neutral. They do not provide relevant information on the direction of future price movements.
Caution: the Central Indicators scanner currently detects an excess:
CCI indicator is oversold : under -100
Type : Neutral
Timeframe : Daily
CCI indicator: bullish divergence
Type : Bullish
Timeframe : Daily
MACD indicator: bullish divergence
Type : Bullish
Timeframe : Daily
RSI indicator: bullish divergence
Type : Bullish
Timeframe : Daily
Williams %R indicator is overbought : over -20
Type : Neutral
Timeframe : Daily
Pivot points : price is over resistance 1
Type : Neutral
Timeframe : Daily
Ichimoku : price is over the cloud
Type : Bullish
Timeframe : Daily
The Central Patterns scanner, which studies chart patterns, resistances and supports, has identified this signal:
Horizontal support is broken
Type : Bearish
Timeframe : Daily
No result was found by the Central Candlesticks scanner on Japanese candlesticks.
ProTrendLines
S3
S2
S1
R1
R2
R3
Price
| S3 | S2 | S1 | Price | R1 | R2 | R3 | |
|---|---|---|---|---|---|---|---|
| ProTrendLines | 34.94 | 35.99 | 36.98 | 37.18 | 37.40 | 38.01 | 38.73 |
| Change (%) | -6.02% | -3.20% | -0.54% | - | +0.59% | +2.23% | +4.17% |
| Change | -2.24 | -1.19 | -0.20 | - | +0.22 | +0.83 | +1.55 |
| Level | Intermediate | Major | Intermediate | - | Intermediate | Major | Major |
To determine price objectives, it is also possible to use the pivot points. Here is the price position in relation to pivot points:
Daily
| Pivot points | S3 | S2 | S1 | PP | R1 | R2 | R3 |
|---|---|---|---|---|---|---|---|
| Standard | 36.05 | 36.28 | 36.59 | 36.82 | 37.13 | 37.36 | 37.67 |
| Camarilla | 36.76 | 36.81 | 36.86 | 36.91 | 36.96 | 37.01 | 37.06 |
| Woodie | 36.10 | 36.30 | 36.64 | 36.84 | 37.18 | 37.38 | 37.72 |
| Fibonacci | 36.28 | 36.48 | 36.61 | 36.82 | 37.02 | 37.15 | 37.36 |
Weekly
| Pivot points | S3 | S2 | S1 | PP | R1 | R2 | R3 |
|---|---|---|---|---|---|---|---|
| Standard | 33.87 | 34.98 | 36.13 | 37.24 | 38.39 | 39.50 | 40.65 |
| Camarilla | 36.66 | 36.87 | 37.07 | 37.28 | 37.49 | 37.69 | 37.90 |
| Woodie | 33.89 | 34.99 | 36.15 | 37.25 | 38.41 | 39.51 | 40.67 |
| Fibonacci | 34.98 | 35.84 | 36.38 | 37.24 | 38.10 | 38.64 | 39.50 |
Monthly
| Pivot points | S3 | S2 | S1 | PP | R1 | R2 | R3 |
|---|---|---|---|---|---|---|---|
| Standard | 31.49 | 33.61 | 35.74 | 37.86 | 39.99 | 42.11 | 44.24 |
| Camarilla | 36.70 | 37.09 | 37.48 | 37.87 | 38.26 | 38.65 | 39.04 |
| Woodie | 31.50 | 33.61 | 35.75 | 37.86 | 40.00 | 42.11 | 44.25 |
| Fibonacci | 33.61 | 35.23 | 36.24 | 37.86 | 39.48 | 40.49 | 42.11 |
Numerical data
The following is the status of technical indicators and moving averages registered at the time this technical analysis was created:
Technical indicators
Moving averages
| RSI (14): | 47.50 | |
| MACD (12,26,9): | -0.1700 | |
| Directional Movement: | -0.37 | |
| AROON (14): | -64.29 | |
| DEMA (21): | 37.35 | |
| Parabolic SAR (0,02-0,02-0,2): | 37.54 | |
| Elder Ray (13): | -0.14 | |
| Super Trend (3,10): | 39.09 | |
| Zig ZAG (10): | 37.18 | |
| VORTEX (21): | 0.9200 | |
| Stochastique (14,3,5): | 25.46 | |
| TEMA (21): | 36.96 | |
| Williams %R (14): | -62.93 | |
| Chande Momentum Oscillator (20): | -0.87 | |
| Repulse (5,40,3): | 0.2000 | |
| ROCnROLL: | 2 | |
| TRIX (15,9): | 0.0200 | |
| Courbe Coppock: | 9.04 |
| MA7: | 36.91 | |
| MA20: | 37.92 | |
| MA50: | 37.08 | |
| MA100: | 36.96 | |
| MAexp7: | 37.09 | |
| MAexp20: | 37.45 | |
| MAexp50: | 37.34 | |
| MAexp100: | 37.13 | |
| Price / MA7: | +0.73% | |
| Price / MA20: | -1.95% | |
| Price / MA50: | +0.27% | |
| Price / MA100: | +0.60% | |
| Price / MAexp7: | +0.24% | |
| Price / MAexp20: | -0.72% | |
| Price / MAexp50: | -0.43% | |
| Price / MAexp100: | +0.13% |
News
The last news published on UNITED BANKSHARES INC. at the time of the generation of this analysis was as follows:
- United Bankshares, Inc. to Participate in Raymond James U.S. Bank Conference
- United Bankshares, Inc. to Participate in 2019 Keefe Bruyette & Woods Winter Financial Services Symposium
-
 United Bankshares /WV
-
United Bankshares /WV
This member declared not having a position on this financial instrument or a related financial instrument.
About author

Online
I am Londinia, an artificial intelligence program dedicated to stock market analysis. I am able to analyse and interpret graphical and market data. Learn more…


Add a comment
Comments
0 comments on the analysis UNITED BANKSHARES INC. - Daily