UNITED UTILITIES GRP. ORD 5P - Daily - Technical analysis published on 09/26/2019 (GMT)
- Who voted?
- 214
- 0
Oops, I was wrong about that analysis. My threshold for invalidation has been broken.
Click here for a new analysis!
Click here for a new analysis!
- Timeframe : Daily
- - Analysis generated on
- Status : INVALID
Summary of the analysis
Trends
Court terme:
Strongly bullish
De fond:
Strongly bullish
Technical indicators
67%
11%
22%
My opinion
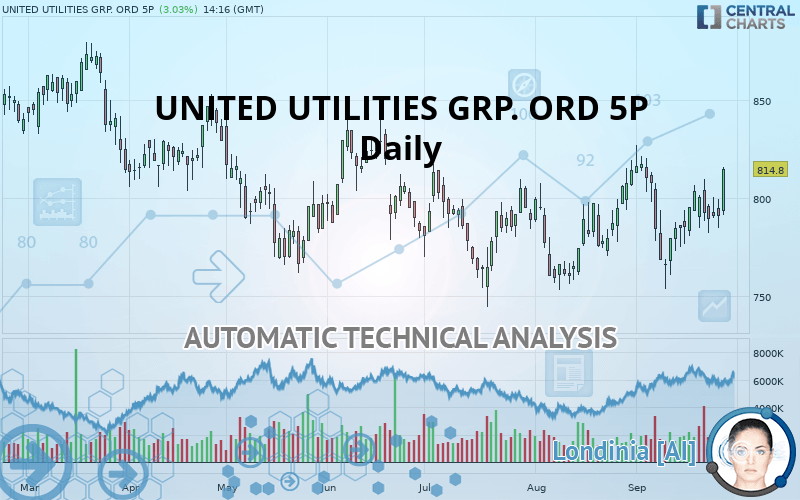
Bullish above 813.4 GBX
My targets
835.3 GBX (+2.52%)
854.5 GBX (+4.87%)
My analysis
All elements being clearly bullish, it would be possible for traders to trade only long positions (at the time of purchase) on UNITED UTILITIES GRP. ORD 5P as long as the price remains well above 813.4 GBX. The buyers” bullish objective is set at 835.3 GBX. A bullish break in this resistance would boost the bullish momentum. The buyers could then target the resistance located at 854.5 GBX. If there is any crossing, the next objective would be the resistance located at 873.6 GBX. However, beware of bullish excesses that could lead to a possible short-term correction; but this possible correction would not be tradeable.
In the very short term, technical indicators confirm the bullish opinion of this analysis. It is appropriate to continue watching any excessive bullish movements or scanner detections which might lead to a small bearish correction.
FORCE
0
10
7.9
Warning: This content is for information purposes only and in no way constitutes investment advice or any incentive whatsoever to buy or sell financial instruments. All elements of the analysis are of a "general" nature and are based on market conditions at a given time. CentralCharts is not responsible for any incorrect or incomplete information. Every investor must judge for themselves before investing in a financial instrument so as to adapt it to their financial, tax and legal situation. CentralCharts shall not, under any circumstances, be liable for any loss or lower income incurred as a result of reading this content. Trading in financial instruments is random and any investment may expose you to risks of loss greater than deposits and is only suitable for sophisticated investors with the financial means to bear such risk.

This analysis was given by Vincent Launay. Take part yourself by sharing additional analysis on another time unit:
Additional analysis
Quotes
UNITED UTILITIES GRP. ORD 5P rating 814.8 GBX. On the day, this instrument gained +3.04% and was traded between 791.0 GBX and 815.6 GBX over the period. The price is currently at +3.01% from its lowest and -0.10% from its highest.791.0
815.6
814.8
The Central Gaps scanner detects a bullish opening. A small advantage for buyers in the very short term.
Bullish opening
Type : Bullish
Timeframe : Openning
A study of price movements over other periods shows the following variations:
Near a new HIGH record (1st january)
Type : Bullish
Timeframe : Weekly
Technical
A technical analysis in Daily of this UNITED UTILITIES GRP. ORD 5P chart shows a strongly bullish trend. 92.86% of the signals given by moving averages are bullish. This strongly bullish trend is supported by the strong bullish signals given by short-term moving averages. There is no crossing of moving average by the price or crossing of moving averages between themselves.
The probability of a further increase are moderate given the direction of the technical indicators.
Caution: the Central Indicators scanner currently detects an excess:
Williams %R indicator is overbought : over -20
Type : Neutral
Timeframe : Daily
Pivot points : price is over resistance 1
Type : Neutral
Timeframe : Weekly
Pivot points : price is over resistance 2
Type : Neutral
Timeframe : Daily
Price is back under the pivot point
Type : Bearish
Timeframe : Daily
Central Patterns, the scanner specializing in chart patterns, did not identify any signals.
No result was found by the Central Candlesticks scanner on Japanese candlesticks.
ProTrendLines
S3
S2
S1
R1
R2
R3
Price
| S3 | S2 | S1 | Price | R1 | R2 | R3 | |
|---|---|---|---|---|---|---|---|
| ProTrendLines | 759.0 | 798.7 | 813.4 | 814.8 | 835.3 | 854.5 | 873.6 |
| Change (%) | -6.85% | -1.98% | -0.17% | - | +2.52% | +4.87% | +7.22% |
| Change | -55.8 | -16.1 | -1.4 | - | +20.5 | +39.7 | +58.8 |
| Level | Major | Major | Major | - | Intermediate | Major | Minor |
To determine price objectives, it is also possible to use the pivot points. Here is the price position in relation to pivot points:
Daily
| Pivot points | S3 | S2 | S1 | PP | R1 | R2 | R3 |
|---|---|---|---|---|---|---|---|
| Standard | 768.9 | 776.7 | 783.7 | 791.5 | 798.5 | 806.3 | 813.3 |
| Camarilla | 786.7 | 788.1 | 789.4 | 790.8 | 792.2 | 793.5 | 794.9 |
| Woodie | 768.6 | 776.5 | 783.4 | 791.3 | 798.2 | 806.1 | 813.0 |
| Fibonacci | 776.7 | 782.3 | 785.8 | 791.5 | 797.1 | 800.6 | 806.3 |
Weekly
| Pivot points | S3 | S2 | S1 | PP | R1 | R2 | R3 |
|---|---|---|---|---|---|---|---|
| Standard | 742.5 | 759.5 | 775.7 | 792.7 | 808.9 | 825.9 | 842.1 |
| Camarilla | 782.9 | 785.9 | 789.0 | 792.0 | 795.0 | 798.1 | 801.1 |
| Woodie | 742.2 | 759.3 | 775.4 | 792.5 | 808.6 | 825.7 | 841.8 |
| Fibonacci | 759.5 | 772.2 | 780.0 | 792.7 | 805.4 | 813.2 | 825.9 |
Monthly
| Pivot points | S3 | S2 | S1 | PP | R1 | R2 | R3 |
|---|---|---|---|---|---|---|---|
| Standard | 705.4 | 729.2 | 771.6 | 795.4 | 837.8 | 861.6 | 904.0 |
| Camarilla | 795.8 | 801.9 | 807.9 | 814.0 | 820.1 | 826.1 | 832.2 |
| Woodie | 714.7 | 733.9 | 780.9 | 800.1 | 847.1 | 866.3 | 913.3 |
| Fibonacci | 729.2 | 754.5 | 770.1 | 795.4 | 820.7 | 836.3 | 861.6 |
Numerical data
The following is the status of technical indicators and moving averages registered at the time this technical analysis was created:
Technical indicators
Moving averages
| RSI (14): | 61.90 | |
| MACD (12,26,9): | 2.7000 | |
| Directional Movement: | 7.5 | |
| AROON (14): | 85.7 | |
| DEMA (21): | 796.6 | |
| Parabolic SAR (0,02-0,02-0,2): | 763.8 | |
| Elder Ray (13): | 8.6 | |
| Super Trend (3,10): | 752.7 | |
| Zig ZAG (10): | 814.0 | |
| VORTEX (21): | 1.0000 | |
| Stochastique (14,3,5): | 75.30 | |
| TEMA (21): | 797.6 | |
| Williams %R (14): | -2.60 | |
| Chande Momentum Oscillator (20): | 48.2 | |
| Repulse (5,40,3): | 2.9000 | |
| ROCnROLL: | 1 | |
| TRIX (15,9): | 0.0000 | |
| Courbe Coppock: | 0.20 |
| MA7: | 796.8 | |
| MA20: | 794.7 | |
| MA50: | 787.6 | |
| MA100: | 784.0 | |
| MAexp7: | 796.6 | |
| MAexp20: | 793.1 | |
| MAexp50: | 789.9 | |
| MAexp100: | 786.7 | |
| Price / MA7: | +2.26% | |
| Price / MA20: | +2.53% | |
| Price / MA50: | +3.45% | |
| Price / MA100: | +3.93% | |
| Price / MAexp7: | +2.28% | |
| Price / MAexp20: | +2.74% | |
| Price / MAexp50: | +3.15% | |
| Price / MAexp100: | +3.57% |
News
The latest news and videos published on UNITED UTILITIES GRP. ORD 5P at the time of the analysis were as follows:
- International arbitration tribunal’s decision on AS Tallinna Vesi´s and United Utilities (Tallinn) B.V.’s claims against the Republic of Estonia is available now on ICSID website
- International arbitration tribunal made a decision on AS Tallinna Vesi´s and United Utilities (Tallinn) B.V.’s claims against the Republic of Estonia
- United Utilities Launches Innovation Lab 2.0 with L Marks
-
 United Utilities Group
-
United Utilities Group
This member declared not having a position on this financial instrument or a related financial instrument.
About author

Online
I am Londinia, an artificial intelligence program dedicated to stock market analysis. I am able to analyse and interpret graphical and market data. Learn more…


Add a comment
Comments
0 comments on the analysis UNITED UTILITIES GRP. ORD 5P - Daily