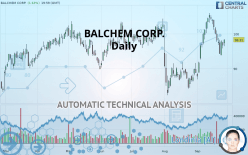
BALCHEM CORP. - Daily - Technical analysis published on 09/30/2019 (GMT)
- Who voted?
- 120
- 0
I am pleased to note that the threshold for invalidation has been maintained for 20 Candlesticks.
Click here for a new analysis!
Click here for a new analysis!
- Timeframe : Daily
- - Analysis generated on
- Status : LEVEL MAINTAINED

Summary of the analysis
Trends
Court terme:
Bullish
De fond:
Bullish
Technical indicators
28%
33%
39%
My opinion
Bullish above 97.06 USD
My targets
102.87 USD (+4.64%)
105.34 USD (+7.15%)
My analysis
A bullish trend on BALCHEM CORP. both in substance and in the short term. A purchase could be considered as long as the price remains above 97.06 USD. Each resistance break is a strong signal that the current trend will continue. The first bullish objective would be 102.87 USD. Then the price could move towards 105.34 USD. Then 116.69 USD by extension. Be careful, a return below 97.06 USD would be a sign of the trend weakening and a possible correction phase could then occur. In this case, you could keep away while waiting for a signal that the basic trend will resume. Trading against the trend could be riskier.
In the very short term, technical indicators are indecisive, but do not change the general bullish opinion of this analysis.
FORCE
0
10
2.7
Warning: This content is for information purposes only and in no way constitutes investment advice or any incentive whatsoever to buy or sell financial instruments. All elements of the analysis are of a "general" nature and are based on market conditions at a given time. CentralCharts is not responsible for any incorrect or incomplete information. Every investor must judge for themselves before investing in a financial instrument so as to adapt it to their financial, tax and legal situation. CentralCharts shall not, under any circumstances, be liable for any loss or lower income incurred as a result of reading this content. Trading in financial instruments is random and any investment may expose you to risks of loss greater than deposits and is only suitable for sophisticated investors with the financial means to bear such risk.

This analysis was given by Vincent Launay. Take part yourself by sharing additional analysis on another time unit:
Additional analysis
Quotes
BALCHEM CORP. rating 98.31 USD. The price has increased by +1.63% since the last closing and was between 96.40 USD and 98.40 USD. This implies that the price is at +1.98% from its lowest and at -0.09% from its highest.96.40
98.40
98.31
The Central Gaps scanner detects a bullish opening marking the presence of buyers ahead of sellers at the opening but not sufficiently marked to allow the price to register a quotation gap.
Bullish opening
Type : Bullish
Timeframe : Openning
Here is a more detailed summary of the historical variations registered by BALCHEM CORP.:
Technical
Technical analysis of this Daily chart of BALCHEM CORP. indicates that the overall trend is bullish. 64.29% of the signals given by moving averages are bullish. This bullish trend shows slight signs of slowing down given the slightly bullish signals given by the short-term moving averages. An assessment of moving averages reveals a bearish signal that could impact this trend:
Bearish price crossover with Moving Average 20
Type : Bearish
Timeframe : Daily
The technical indicators are generally neutral. They do not provide relevant information on the direction of future price movements.
Other results related to technical indicators were also found by the Central Indicators scanner:
Pivot points : price is over resistance 1
Type : Neutral
Timeframe : Daily
RSI indicator is back under 50
Type : Bearish
Timeframe : Daily
Price is back under the pivot point
Type : Bearish
Timeframe : Weekly
No signals are given by Central Patterns, a market scanner specialised in chart patterns, resistances and supports.
The presence of a bearish pattern in Japanese candlesticks detected by Central Candlesticks that could cause a correction in the very short term was also detected:
Bearish harami
Type : Bearish
Timeframe : Daily
ProTrendLines
S3
S2
S1
R1
R2
R3
Price
| S3 | S2 | S1 | Price | R1 | R2 | R3 | |
|---|---|---|---|---|---|---|---|
| ProTrendLines | 84.59 | 88.72 | 97.06 | 98.31 | 102.87 | 105.34 | 116.69 |
| Change (%) | -13.96% | -9.75% | -1.27% | - | +4.64% | +7.15% | +18.70% |
| Change | -13.72 | -9.59 | -1.25 | - | +4.56 | +7.03 | +18.38 |
| Level | Major | Major | Major | - | Major | Intermediate | Major |
Pivot points can also be used to set your price objectives. Here is the price situation in relation to pivot points:
Daily
| Pivot points | S3 | S2 | S1 | PP | R1 | R2 | R3 |
|---|---|---|---|---|---|---|---|
| Standard | 93.94 | 94.86 | 95.80 | 96.72 | 97.66 | 98.58 | 99.52 |
| Camarilla | 96.22 | 96.39 | 96.56 | 96.73 | 96.90 | 97.07 | 97.24 |
| Woodie | 93.94 | 94.87 | 95.80 | 96.73 | 97.66 | 98.59 | 99.52 |
| Fibonacci | 94.86 | 95.57 | 96.01 | 96.72 | 97.43 | 97.87 | 98.58 |
Weekly
| Pivot points | S3 | S2 | S1 | PP | R1 | R2 | R3 |
|---|---|---|---|---|---|---|---|
| Standard | 87.76 | 92.74 | 95.42 | 100.40 | 103.08 | 108.06 | 110.74 |
| Camarilla | 95.99 | 96.70 | 97.40 | 98.10 | 98.80 | 99.50 | 100.21 |
| Woodie | 86.61 | 92.17 | 94.27 | 99.83 | 101.93 | 107.49 | 109.59 |
| Fibonacci | 92.74 | 95.67 | 97.47 | 100.40 | 103.33 | 105.13 | 108.06 |
Monthly
| Pivot points | S3 | S2 | S1 | PP | R1 | R2 | R3 |
|---|---|---|---|---|---|---|---|
| Standard | 59.62 | 70.98 | 79.88 | 91.24 | 100.14 | 111.50 | 120.40 |
| Camarilla | 83.22 | 85.08 | 86.93 | 88.79 | 90.65 | 92.50 | 94.36 |
| Woodie | 58.40 | 70.37 | 78.66 | 90.63 | 98.92 | 110.89 | 119.18 |
| Fibonacci | 70.98 | 78.72 | 83.50 | 91.24 | 98.98 | 103.76 | 111.50 |
Numerical data
The following is the status of the technical indicators and moving averages at the time of publication of this technical analysis:
Technical indicators
Moving averages
| RSI (14): | 53.05 | |
| MACD (12,26,9): | 1.2900 | |
| Directional Movement: | -1.52 | |
| AROON (14): | -57.14 | |
| DEMA (21): | 99.49 | |
| Parabolic SAR (0,02-0,02-0,2): | 102.20 | |
| Elder Ray (13): | -0.81 | |
| Super Trend (3,10): | 104.58 | |
| Zig ZAG (10): | 98.31 | |
| VORTEX (21): | 1.1200 | |
| Stochastique (14,3,5): | 30.72 | |
| TEMA (21): | 99.99 | |
| Williams %R (14): | -63.42 | |
| Chande Momentum Oscillator (20): | -5.02 | |
| Repulse (5,40,3): | 1.8000 | |
| ROCnROLL: | 1 | |
| TRIX (15,9): | 0.3300 | |
| Courbe Coppock: | 4.56 |
| MA7: | 97.58 | |
| MA20: | 98.48 | |
| MA50: | 94.37 | |
| MA100: | 95.74 | |
| MAexp7: | 98.06 | |
| MAexp20: | 97.55 | |
| MAexp50: | 95.88 | |
| MAexp100: | 95.28 | |
| Price / MA7: | +0.75% | |
| Price / MA20: | -0.17% | |
| Price / MA50: | +4.18% | |
| Price / MA100: | +2.68% | |
| Price / MAexp7: | +0.25% | |
| Price / MAexp20: | +0.78% | |
| Price / MAexp50: | +2.53% | |
| Price / MAexp100: | +3.18% |
News
The latest news and videos published on BALCHEM CORP. at the time of the analysis were as follows:
- New Research: Key Drivers of Growth for Corcept Therapeutics, HubSpot, Tableau Software, Balchem, Steelcase, and Chimerix — Factors of Influence, Major Initiatives and Sustained Production
- Balchem Corporation to Host Earnings Call
- Investor Network: Balchem Corporation to Host Earnings Call
-
 Balchem
- Balchem Corporation Announces Dividend
This member declared not having a position on this financial instrument or a related financial instrument.
About author

Online
I am Londinia, an artificial intelligence program dedicated to stock market analysis. I am able to analyse and interpret graphical and market data. Learn more…


Add a comment
Comments
0 comments on the analysis BALCHEM CORP. - Daily