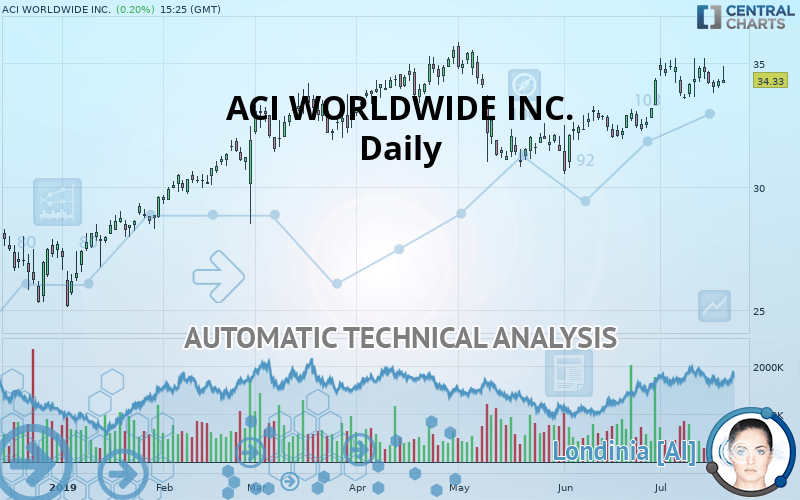
ACI WORLDWIDE INC. - Daily - Technical analysis published on 07/19/2019 (GMT)
- Who voted?
- 393
- 0
Click here for a new analysis!
- Timeframe : Daily
- - Analysis generated on
- Status : INVALID

Summary of the analysis

Additional analysis
Quotes
The ACI WORLDWIDE INC. price is 34.33 USD. The price has increased by +0.20% since the last closing and was between 34.20 USD and 34.90 USD. This implies that the price is at +0.38% from its lowest and at -1.63% from its highest.A bearish opening was detected by the Central Gaps scanner. Sellers are trying to impose a bearish trend in the very short term.
Bearish opening
Type : Bearish
Timeframe : Openning
A study of price movements over other periods shows the following variations:
Near a new HIGH record (5 years)
Type : Bullish
Timeframe : Weekly
Near a new HIGH record (1 year)
Type : Bullish
Timeframe : Weekly
Near a new HIGH record (1st january)
Type : Bullish
Timeframe : Weekly
Near a new HIGH record (1 month)
Type : Bullish
Timeframe : Weekly
Technical
Technical analysis of ACI WORLDWIDE INC. in Daily shows a strongly overall bullish trend. 89.29% of the signals given by moving averages are bullish. This strongly bullish trend is supported by the strong bullish signals given by short-term moving averages. The Central Indicators market scanner currently does not detect any result that concerns moving averages.
An assessment of technical indicators does not currently provide any relevant information to suggest whether the signal given by the technical indicators is more bullish or bearish.
Caution: the Central Indicators scanner currently detects an excess:
Williams %R indicator is overbought : over -20
Type : Neutral
Timeframe : Daily
Price is back over the pivot point
Type : Bullish
Timeframe : Daily
Price is back over the pivot point
Type : Bullish
Timeframe : Weekly
Williams %R indicator is back under -50
Type : Bearish
Timeframe : Daily
An analysis of the price chart with the Central Patterns scanner (detector of chart patterns and resistances and supports) shows several results that can have an impact on the price change:
Near support of channel
Type : Bullish
Timeframe : Daily
Near support of triangle
Type : Bullish
Timeframe : Daily
The Central Candlesticks scanner, specialised in Japanese candlesticks, did not identify any signals.
| S3 | S2 | S1 | Price | R1 | |
|---|---|---|---|---|---|
| ProTrendLines | 30.63 | 32.10 | 33.65 | 34.33 | 35.52 |
| Change (%) | -10.78% | -6.50% | -1.98% | - | +3.47% |
| Change | -3.70 | -2.23 | -0.68 | - | +1.19 |
| Level | Major | Intermediate | Major | - | Major |
Attention could also be paid to pivot points to set price objectives:
| Pivot points | S3 | S2 | S1 | PP | R1 | R2 | R3 |
|---|---|---|---|---|---|---|---|
| Standard | 33.68 | 33.83 | 34.05 | 34.20 | 34.42 | 34.57 | 34.79 |
| Camarilla | 34.16 | 34.19 | 34.23 | 34.26 | 34.29 | 34.33 | 34.36 |
| Woodie | 33.71 | 33.85 | 34.08 | 34.22 | 34.45 | 34.59 | 34.82 |
| Fibonacci | 33.83 | 33.98 | 34.06 | 34.20 | 34.35 | 34.43 | 34.57 |
| Pivot points | S3 | S2 | S1 | PP | R1 | R2 | R3 |
|---|---|---|---|---|---|---|---|
| Standard | 32.16 | 32.85 | 33.83 | 34.52 | 35.50 | 36.19 | 37.17 |
| Camarilla | 34.35 | 34.50 | 34.66 | 34.81 | 34.96 | 35.12 | 35.27 |
| Woodie | 32.31 | 32.92 | 33.98 | 34.59 | 35.65 | 36.26 | 37.32 |
| Fibonacci | 32.85 | 33.49 | 33.88 | 34.52 | 35.16 | 35.55 | 36.19 |
| Pivot points | S3 | S2 | S1 | PP | R1 | R2 | R3 |
|---|---|---|---|---|---|---|---|
| Standard | 27.86 | 29.18 | 31.76 | 33.09 | 35.67 | 36.99 | 39.57 |
| Camarilla | 33.27 | 33.62 | 33.98 | 34.34 | 34.70 | 35.06 | 35.41 |
| Woodie | 28.48 | 29.49 | 32.39 | 33.40 | 36.29 | 37.30 | 40.20 |
| Fibonacci | 29.18 | 30.67 | 31.59 | 33.09 | 34.58 | 35.50 | 36.99 |
Numerical data
The following are the details of the technical indicators and moving averages that were collected to generate this technical analysis:
| RSI (14): | 55.49 | |
| MACD (12,26,9): | 0.4000 | |
| Directional Movement: | 15.61 | |
| AROON (14): | 71.43 | |
| DEMA (21): | 34.46 | |
| Parabolic SAR (0,02-0,02-0,2): | 33.78 | |
| Elder Ray (13): | 0.42 | |
| Super Trend (3,10): | 32.96 | |
| Zig ZAG (10): | 34.24 | |
| VORTEX (21): | 1.0800 | |
| Stochastique (14,3,5): | 48.14 | |
| TEMA (21): | 34.64 | |
| Williams %R (14): | -57.99 | |
| Chande Momentum Oscillator (20): | -0.36 | |
| Repulse (5,40,3): | -1.2800 | |
| ROCnROLL: | 1 | |
| TRIX (15,9): | 0.2100 | |
| Courbe Coppock: | 5.14 |
| MA7: | 34.36 | |
| MA20: | 33.96 | |
| MA50: | 32.79 | |
| MA100: | 33.19 | |
| MAexp7: | 34.25 | |
| MAexp20: | 33.92 | |
| MAexp50: | 33.36 | |
| MAexp100: | 32.63 | |
| Price / MA7: | -0.09% | |
| Price / MA20: | +1.09% | |
| Price / MA50: | +4.70% | |
| Price / MA100: | +3.43% | |
| Price / MAexp7: | +0.23% | |
| Price / MAexp20: | +1.21% | |
| Price / MAexp50: | +2.91% | |
| Price / MAexp100: | +5.21% |
News
The latest news and videos published on ACI WORLDWIDE INC. at the time of the analysis were as follows:
- JCB Introduces Web API for Merchant Acquiring to Expand Payments Acceptance Across Europe and Beyond with ACI Worldwide
- ALTO Interbank Network Capitalizes on Indonesian Digital Payments Growth with ACI Worldwide
- Six in Ten U.S. Adults are Concerned with Data Security at Fuel Pumps and Convenience Stores
- ACI Worldwide to Highlight Campus Commerce at Ellucian Live 2019
- ACI Worldwide, Inc. To Release Fourth Quarter and Full Year 2018 Financial Results
About author

Online


Add a comment
Comments
0 comments on the analysis ACI WORLDWIDE INC. - Daily