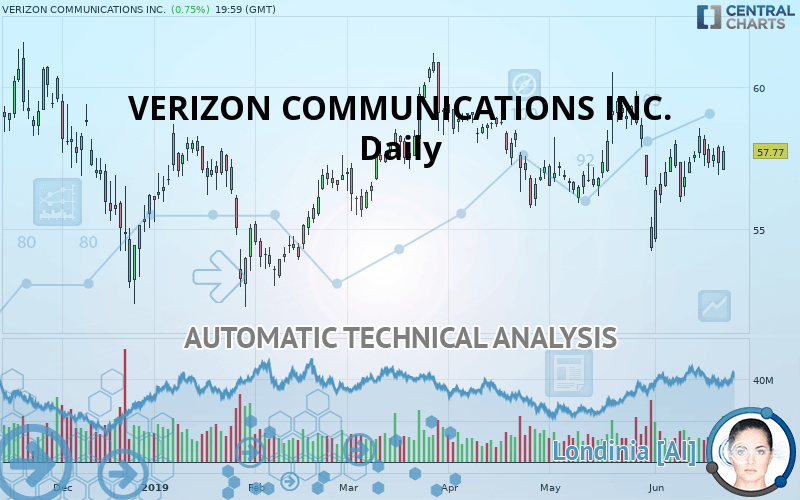
VERIZON COMMUNICATIONS INC. - Daily - Technical analysis published on 06/24/2019 (GMT)
- Who voted?
- 236
- 0
Click here for a new analysis!
- Timeframe : Daily
- - Analysis generated on
- Status : TARGET REACHED

Summary of the analysis

Additional analysis
Quotes
VERIZON COMMUNICATIONS INC. rating 57.77 USD. The price registered an increase of +0.75% on the session and was between 57.09 USD and 57.92 USD. This implies that the price is at +1.19% from its lowest and at -0.26% from its highest.The Central Gaps scanner detects a bullish opening marking the presence of sellers ahead of buyers at the opening but not sufficiently marked to allow the price to register a quotation gap.
Bearish opening
Type : Bearish
Timeframe : Openning
Here is a more detailed summary of the historical variations registered by VERIZON COMMUNICATIONS INC.:
Technical
Technical analysis of this Daily chart of VERIZON COMMUNICATIONS INC. indicates that the overall trend is bullish. 75% of the signals given by moving averages are bullish. This bullish trend shows slight signs of slowing down given the slightly bullish signals given by the short-term moving averages. The Central Indicators scanner detects bearish signals on moving averages that could impact this trend:
Bearish price crossover with Moving Average 20
Type : Bearish
Timeframe : Daily
Bearish price crossover with Moving Average 50
Type : Bearish
Timeframe : Daily
Bearish price crossover with adaptative moving average 20
Type : Bearish
Timeframe : Daily
In fact, according to the parameters integrated into the Central Analyzer system, 13 technical indicators out of 18 analysed are currently bullish. Caution: the Central Indicators scanner currently detects an excess:
Williams %R indicator is overbought : over -20
Type : Neutral
Timeframe : Daily
RSI indicator is back under 50
Type : Bearish
Timeframe : Daily
MACD indicator is back under 0
Type : Bearish
Timeframe : Daily
Price is back over the pivot point
Type : Bullish
Timeframe : Weekly
Price is back under the pivot point
Type : Bearish
Timeframe : Daily
Central Patterns, the market scanner focusing on chart patterns, resistances and supports found this result:
Near horizontal resistance
Type : Bearish
Timeframe : Daily
The presence of a bearish pattern in Japanese candlesticks detected by Central Candlesticks that could cause a correction in the very short term was also detected:
Bearish engulfing lines
Type : Bearish
Timeframe : Daily
| S3 | S2 | S1 | Price | R1 | R2 | R3 | |
|---|---|---|---|---|---|---|---|
| ProTrendLines | 54.69 | 55.85 | 56.53 | 57.77 | 58.38 | 59.50 | 60.65 |
| Change (%) | -5.33% | -3.32% | -2.15% | - | +1.06% | +2.99% | +4.99% |
| Change | -3.08 | -1.92 | -1.24 | - | +0.61 | +1.73 | +2.88 |
| Level | Major | Major | Major | - | Major | Intermediate | Major |
Pivot points can also be used to set your price objectives. Here is the price situation in relation to pivot points:
| Pivot points | S3 | S2 | S1 | PP | R1 | R2 | R3 |
|---|---|---|---|---|---|---|---|
| Standard | 55.84 | 56.39 | 56.86 | 57.41 | 57.88 | 58.43 | 58.90 |
| Camarilla | 57.06 | 57.15 | 57.25 | 57.34 | 57.43 | 57.53 | 57.62 |
| Woodie | 55.81 | 56.37 | 56.83 | 57.39 | 57.85 | 58.41 | 58.87 |
| Fibonacci | 56.39 | 56.78 | 57.02 | 57.41 | 57.80 | 58.04 | 58.43 |
| Pivot points | S3 | S2 | S1 | PP | R1 | R2 | R3 |
|---|---|---|---|---|---|---|---|
| Standard | 54.02 | 54.99 | 56.63 | 57.60 | 59.24 | 60.21 | 61.85 |
| Camarilla | 57.56 | 57.80 | 58.04 | 58.28 | 58.52 | 58.76 | 59.00 |
| Woodie | 54.37 | 55.16 | 56.97 | 57.77 | 59.58 | 60.38 | 62.19 |
| Fibonacci | 54.99 | 55.98 | 56.60 | 57.60 | 58.59 | 59.21 | 60.21 |
Numerical data
The following is the status of technical indicators and moving averages registered at the time this technical analysis was created:
| RSI (14): | 52.28 | |
| MACD (12,26,9): | 0.0300 | |
| Directional Movement: | -0.59 | |
| AROON (14): | 64.29 | |
| DEMA (21): | 57.42 | |
| Parabolic SAR (0,02-0,02-0,2): | 54.67 | |
| Elder Ray (13): | 0.06 | |
| Super Trend (3,10): | 58.35 | |
| Zig ZAG (10): | 57.77 | |
| VORTEX (21): | 0.9300 | |
| Stochastique (14,3,5): | 72.63 | |
| TEMA (21): | 57.51 | |
| Williams %R (14): | -29.98 | |
| Chande Momentum Oscillator (20): | 0.74 | |
| Repulse (5,40,3): | 0.6800 | |
| ROCnROLL: | 1 | |
| TRIX (15,9): | -0.0100 | |
| Courbe Coppock: | 1.62 |
| MA7: | 57.66 | |
| MA20: | 57.29 | |
| MA50: | 57.43 | |
| MA100: | 57.17 | |
| MAexp7: | 57.53 | |
| MAexp20: | 57.42 | |
| MAexp50: | 57.45 | |
| MAexp100: | 57.21 | |
| Price / MA7: | +0.19% | |
| Price / MA20: | +0.84% | |
| Price / MA50: | +0.59% | |
| Price / MA100: | +1.05% | |
| Price / MAexp7: | +0.42% | |
| Price / MAexp20: | +0.61% | |
| Price / MAexp50: | +0.56% | |
| Price / MAexp100: | +0.98% |
News
Don"t forget to follow the news on VERIZON COMMUNICATIONS INC.. At the time of publication of this analysis, the latest news was as follows:
-
 Verizon Shares Drop After Missing Quarterly Revenue Estimates
- Thinking about buying stock in Avalon GloboCare Corp., MagneGas, Square Inc., Trevena Inc. or Verizon Communications?
-
Verizon Cuts Media Jobs
-
Verizon CEO on what 5G means for consumers
- Verizon and Cat® Phones Partner to Bring the Cat® S48c Smartphone to Verizon Customers
About author

Online


Add a comment
Comments
0 comments on the analysis VERIZON COMMUNICATIONS INC. - Daily