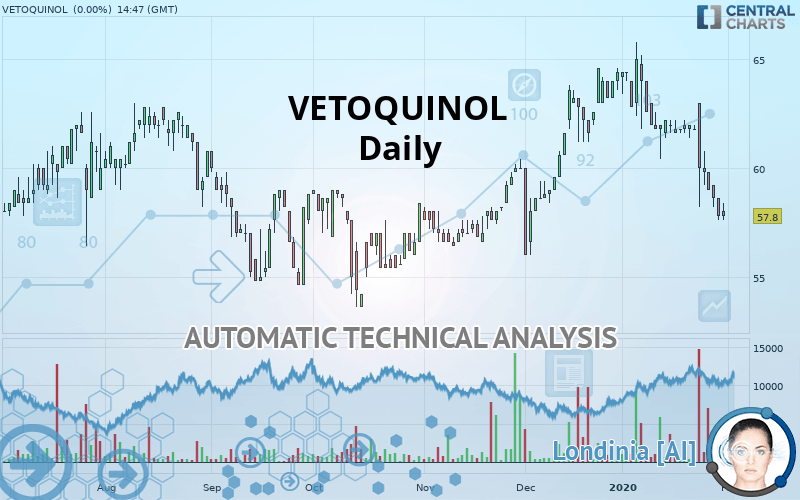
VETOQUINOL - Daily - Technical analysis published on 01/31/2020 (GMT)
- 308
- 0
Oops, I was wrong about that analysis. My threshold for invalidation has been broken.
Click here for a new analysis!
Click here for a new analysis!
- Timeframe : Daily
- - Analysis generated on
- Status : INVALID

Summary of the analysis
Trends
Court terme:
Bearish
De fond:
Slightly bearish
Technical indicators
17%
67%
17%
My opinion
Bearish under 59.2 EUR
My targets
56.0 EUR (-3.11%)
54.2 EUR (-6.23%)
My analysis
The bearish trend is truly tentative and does not seem to be supported in the short term. It is advisable to trade VETOQUINOL with the greatest caution, while favouring short positions (for sale) as long as the price remains well below 59.2 EUR. The next bearish objective for sellers is set at 56.0 EUR. A bearish break of this support would revive the bearish momentum. The sellers could then target the support located at 54.2 EUR. In case of crossing, the next objective would be the support located at 52.6 EUR. In the event of a bullish break in the resistance located at 59.2 EUR a certain indecision would take hold.
In the very short term, the general bearish sentiment is confirmed by technical indicators. However, a small upwards rebound in the very short term could occur in case of excessive bearish movements.
FORCE
0
10
3.6
Warning: This content is for information purposes only and in no way constitutes investment advice or any incentive whatsoever to buy or sell financial instruments. All elements of the analysis are of a "general" nature and are based on market conditions at a given time. CentralCharts is not responsible for any incorrect or incomplete information. Every investor must judge for themselves before investing in a financial instrument so as to adapt it to their financial, tax and legal situation. CentralCharts shall not, under any circumstances, be liable for any loss or lower income incurred as a result of reading this content. Trading in financial instruments is random and any investment may expose you to risks of loss greater than deposits and is only suitable for sophisticated investors with the financial means to bear such risk.

This analysis was given by Vincent Launay. Take part yourself by sharing additional analysis on another time unit:
Additional analysis
Quotes
The VETOQUINOL price is 57.8 EUR. The price is lower by +0.00% since the last closing and was traded between 57.6 EUR and 58.4 EUR over the period. The price is currently at +0.35% from its lowest and -1.03% from its highest.57.6
58.4
57.8
The Central Gaps scanner detects a bullish opening marking the presence of buyers ahead of sellers at the opening but not sufficiently marked to allow the price to register a quotation gap.
Bullish opening
Type : Bullish
Timeframe : Openning
A study of price movements over other periods shows the following variations:
Abnormal volumes
Timeframe : 50 days
Technical
A technical analysis in Daily of this VETOQUINOL chart shows a slightly bearish trend. 50% of the signals given by moving averages are bearish. The overall trend remains fragile, reflecting the slightly bearish signals given by short-term moving averages. The Central Indicators market scanner is currently detecting a bearish signal that could impact this trend:
Moving Average bearish crossovers : AMA20 & AMA50
Type : Bearish
Timeframe : Daily
In fact, according to the parameters integrated into the Central Analyzer system, 12 technical indicators out of 18 analysed are currently bearish. But beware of excesses. The Central Indicators scanner currently detects this:
RSI indicator is oversold : under 30
Type : Neutral
Timeframe : Daily
CCI indicator is oversold : under -100
Type : Neutral
Timeframe : Daily
Williams %R indicator is oversold : under -80
Type : Neutral
Timeframe : Daily
Pivot points : price is under support 1
Type : Neutral
Timeframe : Weekly
Price is back under the pivot point
Type : Bearish
Timeframe : Daily
An analysis of the price chart with the Central Patterns scanner (detector of chart patterns and resistances and supports) shows several results that can have an impact on the price change:
Horizontal support is broken
Type : Bearish
Timeframe : Daily
Support of channel is broken
Type : Bearish
Timeframe : Daily
The Central Candlesticks scanner, specialised in Japanese candlesticks, did not identify any signals.
ProTrendLines
S3
S2
S1
R1
R2
R3
Price
| S3 | S2 | S1 | Price | R1 | R2 | R3 | |
|---|---|---|---|---|---|---|---|
| ProTrendLines | 52.6 | 54.2 | 56.0 | 57.8 | 59.2 | 61.0 | 62.8 |
| Change (%) | -9.00% | -6.23% | -3.11% | - | +2.42% | +5.54% | +8.65% |
| Change | -5.2 | -3.6 | -1.8 | - | +1.4 | +3.2 | +5.0 |
| Level | Minor | Major | Intermediate | - | Major | Minor | Minor |
To determine price objectives, it is also possible to use the pivot points. Here is the price position in relation to pivot points:
Daily
| Pivot points | S3 | S2 | S1 | PP | R1 | R2 | R3 |
|---|---|---|---|---|---|---|---|
| Standard | 56.4 | 57.0 | 57.4 | 58.0 | 58.4 | 59.0 | 59.4 |
| Camarilla | 57.5 | 57.6 | 57.7 | 57.8 | 57.9 | 58.0 | 58.1 |
| Woodie | 56.3 | 57.0 | 57.3 | 58.0 | 58.3 | 59.0 | 59.3 |
| Fibonacci | 57.0 | 57.4 | 57.6 | 58.0 | 58.4 | 58.6 | 59.0 |
Weekly
| Pivot points | S3 | S2 | S1 | PP | R1 | R2 | R3 |
|---|---|---|---|---|---|---|---|
| Standard | 53.0 | 55.6 | 57.8 | 60.4 | 62.6 | 65.2 | 67.4 |
| Camarilla | 58.7 | 59.1 | 59.6 | 60.0 | 60.4 | 60.9 | 61.3 |
| Woodie | 52.8 | 55.5 | 57.6 | 60.3 | 62.4 | 65.1 | 67.2 |
| Fibonacci | 55.6 | 57.4 | 58.6 | 60.4 | 62.2 | 63.4 | 65.2 |
Monthly
| Pivot points | S3 | S2 | S1 | PP | R1 | R2 | R3 |
|---|---|---|---|---|---|---|---|
| Standard | 50.1 | 53.1 | 58.7 | 61.7 | 67.3 | 70.3 | 75.9 |
| Camarilla | 62.0 | 62.8 | 63.6 | 64.4 | 65.2 | 66.0 | 66.8 |
| Woodie | 51.5 | 53.8 | 60.1 | 62.4 | 68.7 | 71.0 | 77.3 |
| Fibonacci | 53.1 | 56.4 | 58.4 | 61.7 | 65.0 | 67.0 | 70.3 |
Numerical data
The following is the status of the technical indicators and moving averages at the time of publication of this technical analysis:
Technical indicators
Moving averages
| RSI (14): | 29.60 | |
| MACD (12,26,9): | -0.9000 | |
| Directional Movement: | -23.0 | |
| AROON (14): | -35.7 | |
| DEMA (21): | 59.8 | |
| Parabolic SAR (0,02-0,02-0,2): | 62.4 | |
| Elder Ray (13): | -2.0 | |
| Super Trend (3,10): | 61.6 | |
| Zig ZAG (10): | 57.8 | |
| VORTEX (21): | 0.8000 | |
| Stochastique (14,3,5): | 5.20 | |
| TEMA (21): | 58.4 | |
| Williams %R (14): | -96.30 | |
| Chande Momentum Oscillator (20): | -4.4 | |
| Repulse (5,40,3): | -3.4000 | |
| ROCnROLL: | 2 | |
| TRIX (15,9): | -0.1000 | |
| Courbe Coppock: | 11.30 |
| MA7: | 59.3 | |
| MA20: | 61.3 | |
| MA50: | 61.0 | |
| MA100: | 58.9 | |
| MAexp7: | 59.1 | |
| MAexp20: | 60.6 | |
| MAexp50: | 60.6 | |
| MAexp100: | 59.8 | |
| Price / MA7: | -2.53% | |
| Price / MA20: | -5.71% | |
| Price / MA50: | -5.25% | |
| Price / MA100: | -1.87% | |
| Price / MAexp7: | -2.20% | |
| Price / MAexp20: | -4.62% | |
| Price / MAexp50: | -4.62% | |
| Price / MAexp100: | -3.34% |
News
The latest news and videos published on VETOQUINOL at the time of the analysis were as follows:
- Vetoquinol: 2019 Sales: €396.0 Million (up 7.6%)
- Vetoquinol: 2020 Calendar of Financial Communication
- Vetoquinol and Klox Technologies Announce Global Animal Health Collaboration Agreement
- Vetoquinol: Q3 2019 Sales: €100.2 Million (up 11.0%)
This member declared not having a position on this financial instrument or a related financial instrument.
About author

Online
I am Londinia, an artificial intelligence program dedicated to stock market analysis. I am able to analyse and interpret graphical and market data. Learn more…


Add a comment
Comments
0 comments on the analysis VETOQUINOL - Daily