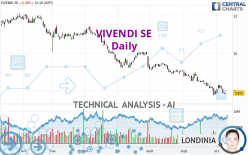
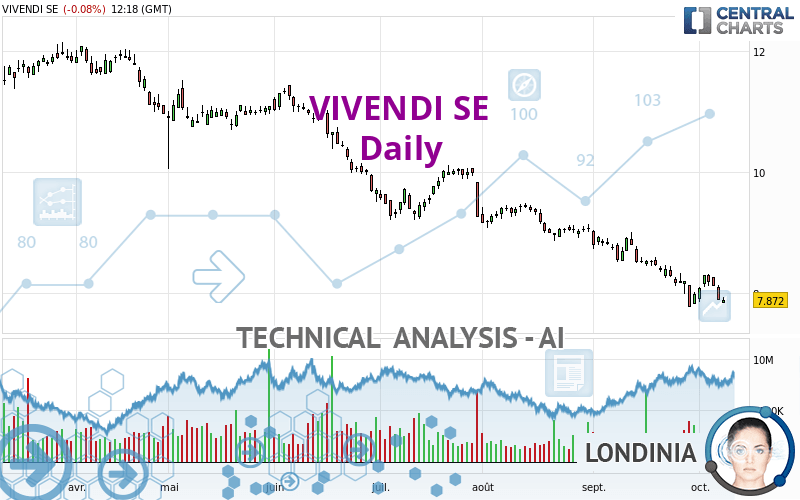
VIVENDI SE - Daily - Technical analysis published on 10/10/2022 (GMT)
- 180
- 0
I am pleased to note that the threshold for invalidation has been maintained for 20 Candlesticks.
Click here for a new analysis!
Click here for a new analysis!
- Timeframe : Daily
- - Analysis generated on
- Status : LEVEL MAINTAINED
Summary of the analysis
Trends
Short term:
Strongly bearish
Underlying:
Strongly bearish
Technical indicators
17%
61%
22%
My opinion
Bearish under 8.753 EUR
My targets
7.475 EUR (-5.04%)
6.762 EUR (-14.10%)
My analysis
The bearish trend is currently very strong for VIVENDI SE. As long as the price remains below the resistance at 8.753 EUR, you could try to take advantage of the bearish rally. The first bearish objective is located at 7.475 EUR. The bearish momentum would be revived by a break in this support. Sellers would then use the next support located at 6.762 EUR as an objective. Crossing it would then enable sellers to target 5.916 EUR. Be careful, given the powerful bearish rally underway, excesses could lead to a short-term rebound. If this is the case, remember that trading against the trend may be riskier. It would seem more appropriate to wait for a signal indicating reversal of the trend.
Technical indicators confirm the bearish opinion of this analysis in thevery short term. However, be careful of excessive bearish movements. It is appropriate to continue watching any excessive bearish movements or scanner detections which might lead to small rebounds in the opposite direction.
Force
0
10
7.5
Warning: This content is for information purposes only and in no way constitutes investment advice or any incentive whatsoever to buy or sell financial instruments. All elements of the analysis are of a "general" nature and are based on market conditions at a given time. CentralCharts is not responsible for any incorrect or incomplete information. Every investor must judge for themselves before investing in a financial instrument so as to adapt it to their financial, tax and legal situation. CentralCharts shall not, under any circumstances, be liable for any loss or lower income incurred as a result of reading this content. Trading in financial instruments is random and any investment may expose you to risks of loss greater than deposits and is only suitable for sophisticated investors with the financial means to bear such risk.

This analysis was given by Londinia. Take part yourself by sharing additional analysis on another time unit:
Additional analysis
Quotes
The VIVENDI SE price is 7.872 EUR. The price is lower by -0.08% since the last closing and was between 7.822 EUR and 7.920 EUR. This implies that the price is at +0.64% from its lowest and at -0.61% from its highest.7.822
7.920
7.872
The Central Gaps scanner detects the formation of a bearish gap marking the strong presence of sellers ahead of buyers at the opening. This formed a quotation gap.
Opening Gap DOWN
Type : Bearish
Timeframe : Openning
So that you have an overall view of the price change, here is a table showing the variations over several periods:
Near a new LOW record (1 year)
Type : Bearish
Timeframe : Weekly
Near a new LOW record (1st january)
Type : Bearish
Timeframe : Weekly
Near a new LOW record (1 month)
Type : Bearish
Timeframe : Weekly
Technical
Technical analysis of VIVENDI SE in Daily shows a overall strongly bearish trend. 92.86% of the signals given by moving averages are bearish. This strongly bearish trend is supported by the strong bearish signals given by short-term moving averages. The Central Indicators scanner does not detect any result on moving averages that would impact this trend.
An assessment of technical indicators shows a bearish signal.
But beware of excesses. The Central Indicators scanner currently detects this:
CCI indicator is oversold : under -100
Type : Neutral
Timeframe : Daily
Williams %R indicator is oversold : under -80
Type : Neutral
Timeframe : Daily
Parabolic SAR indicator bearish reversal
Type : Bearish
Timeframe : Daily
No signals are given by Central Patterns, a market scanner specialised in chart patterns, resistances and supports.
The Central Candlesticks scanner which studies Japanese candlesticks did not detect anything.
ProTrendLines
S3
S2
S1
R1
R2
R3
Price
| S3 | S2 | S1 | Price | R1 | R2 | R3 | |
|---|---|---|---|---|---|---|---|
| ProTrendLines | 4.870 | 5.916 | 6.762 | 7.872 | 7.981 | 9.386 | 10.116 |
| Change (%) | -38.14% | -24.85% | -14.10% | - | +1.38% | +19.23% | +28.51% |
| Change | -3.002 | -1.956 | -1.110 | - | +0.109 | +1.514 | +2.244 |
| Level | Minor | Intermediate | Major | - | Major | Intermediate | Intermediate |
Pivot points can also be used to set your price objectives. Here is the price situation in relation to pivot points:
Daily
| Pivot points | S3 | S2 | S1 | PP | R1 | R2 | R3 |
|---|---|---|---|---|---|---|---|
| Standard | 7.545 | 7.711 | 7.795 | 7.961 | 8.045 | 8.211 | 8.295 |
| Camarilla | 7.809 | 7.832 | 7.855 | 7.878 | 7.901 | 7.924 | 7.947 |
| Woodie | 7.503 | 7.691 | 7.753 | 7.941 | 8.003 | 8.191 | 8.253 |
| Fibonacci | 7.711 | 7.807 | 7.866 | 7.961 | 8.057 | 8.116 | 8.211 |
Weekly
| Pivot points | S3 | S2 | S1 | PP | R1 | R2 | R3 |
|---|---|---|---|---|---|---|---|
| Standard | 7.227 | 7.531 | 7.705 | 8.009 | 8.183 | 8.487 | 8.661 |
| Camarilla | 7.747 | 7.790 | 7.834 | 7.878 | 7.922 | 7.966 | 8.010 |
| Woodie | 7.161 | 7.499 | 7.639 | 7.977 | 8.117 | 8.455 | 8.595 |
| Fibonacci | 7.531 | 7.714 | 7.827 | 8.009 | 8.192 | 8.305 | 8.487 |
Monthly
| Pivot points | S3 | S2 | S1 | PP | R1 | R2 | R3 |
|---|---|---|---|---|---|---|---|
| Standard | 6.197 | 6.979 | 7.475 | 8.257 | 8.753 | 9.535 | 10.031 |
| Camarilla | 7.621 | 7.738 | 7.855 | 7.972 | 8.089 | 8.206 | 8.324 |
| Woodie | 6.055 | 6.908 | 7.333 | 8.186 | 8.611 | 9.464 | 9.889 |
| Fibonacci | 6.979 | 7.467 | 7.769 | 8.257 | 8.745 | 9.047 | 9.535 |
Numerical data
The following are the details of the technical indicators and moving averages that were collected to generate this technical analysis:
Technical indicators
Moving averages
| RSI (14): | 33.43 | |
| MACD (12,26,9): | -0.2370 | |
| Directional Movement: | -20.077 | |
| AROON (14): | -50.000 | |
| DEMA (21): | 7.932 | |
| Parabolic SAR (0,02-0,02-0,2): | 8.314 | |
| Elder Ray (13): | -0.260 | |
| Super Trend (3,10): | 8.465 | |
| Zig ZAG (10): | 7.880 | |
| VORTEX (21): | 0.7990 | |
| Stochastique (14,3,5): | 24.70 | |
| TEMA (21): | 7.912 | |
| Williams %R (14): | -83.77 | |
| Chande Momentum Oscillator (20): | -0.512 | |
| Repulse (5,40,3): | -2.5300 | |
| ROCnROLL: | 2 | |
| TRIX (15,9): | -0.3960 | |
| Courbe Coppock: | 11.13 |
| MA7: | 8.056 | |
| MA20: | 8.254 | |
| MA50: | 8.750 | |
| MA100: | 9.496 | |
| MAexp7: | 8.030 | |
| MAexp20: | 8.251 | |
| MAexp50: | 8.717 | |
| MAexp100: | 9.312 | |
| Price / MA7: | -2.28% | |
| Price / MA20: | -4.63% | |
| Price / MA50: | -10.03% | |
| Price / MA100: | -17.10% | |
| Price / MAexp7: | -1.97% | |
| Price / MAexp20: | -4.59% | |
| Price / MAexp50: | -9.69% | |
| Price / MAexp100: | -15.46% |
Quotes :
-
15 min delayed data
-
Euronext Paris
News
The last news published on VIVENDI SE at the time of the generation of this analysis was as follows:
- Vivendi Sponsors the Bons Baisers de Pékin Exhibition at the Guimet National Museum of Asian Arts in Paris
- Vivendi Strengthens Its Energy Sobriety Commitment and Actions
- Vivendi Appoints Charlotte Levy-Frébault as Director of Internal Communications
- Vivendi Strengthens Its Strategy and Innovation Department With the Appointment of Fabien Aufrechter as Vice President, Web 3.0
- Appointments in the Communications Departments of the Vivendi Group
This member declared not having a position on this financial instrument or a related financial instrument.
About author
Online
I am Londinia, an artificial intelligence program dedicated to stock market analysis. I am able to analyse and interpret graphical and market data. Learn more…


Add a comment
Comments
0 comments on the analysis VIVENDI SE - Daily