AVAST ORD 10P - Daily - Technical analysis published on 01/16/2020 (GMT)
- Who voted?
- 270
- 0
I am delighted to see that my first price objective has been achieved. I hope you've taken advantage of it.
Click here for a new analysis!
Click here for a new analysis!
- Timeframe : Daily
- - Analysis generated on
- Status : TARGET REACHED
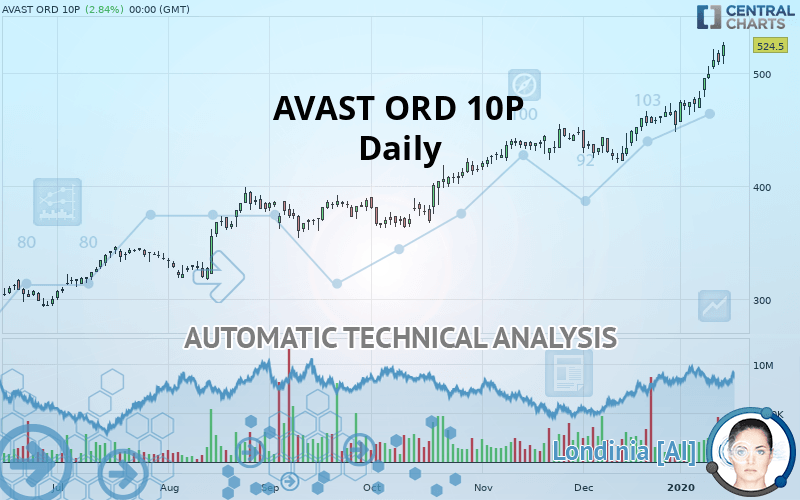
AVAST ORD 10P Chart
Summary of the analysis
Trends
Court terme:
Strongly bullish
De fond:
Strongly bullish
Technical indicators
72%
6%
22%
My opinion
Bullish above 478.2 GBX
My targets
531.4 GBX (+1.32%)
My analysis
The bullish trend is currently very strong on AVAST ORD 10P. As long as the price remains above the support at 478.2 GBX, you could try to benefit from the boom. The first bullish objective is located at 531.4 GBX. The bullish momentum would be boosted by a break in this resistance. Be careful, given the powerful bullish rally underway, excesses could lead to a possible correction in the short term. If this is the case, remember that trading against the trend may be riskier. It would seem more appropriate to wait for a signal indicating reversal of the trend.
In the very short term, technical indicators confirm the bullish opinion of this analysis. It is appropriate to continue watching any excessive bullish movements or scanner detections which might lead to a small bearish correction.
FORCE
0
10
8.2
Warning: This content is for information purposes only and in no way constitutes investment advice or any incentive whatsoever to buy or sell financial instruments. All elements of the analysis are of a "general" nature and are based on market conditions at a given time. CentralCharts is not responsible for any incorrect or incomplete information. Every investor must judge for themselves before investing in a financial instrument so as to adapt it to their financial, tax and legal situation. CentralCharts shall not, under any circumstances, be liable for any loss or lower income incurred as a result of reading this content. Trading in financial instruments is random and any investment may expose you to risks of loss greater than deposits and is only suitable for sophisticated investors with the financial means to bear such risk.
This analysis was given by Vincent Launay.
Additional analysis
Quotes
The AVAST ORD 10P rating is 524.5 GBX. The price registered an increase of +2.84% on the session with the lowest point at 508.0 GBX and the highest point at 527.5 GBX. The deviation from the price is +3.25% for the low point and -0.57% for the high point.508.0
527.5
524.5
A bullish opening was detected by the Central Gaps scanner. Buyers are trying to impose a bullish momentum in the very short term.
Bullish opening
Type : Bullish
Timeframe : Openning
Here is a more detailed summary of the historical variations registered by AVAST ORD 10P:
Near a new HIGH record (1st january)
Type : Bullish
Timeframe : Weekly
Near a new HIGH record (1 month)
Type : Bullish
Timeframe : Weekly
Technical
A technical analysis in Daily of this AVAST ORD 10P chart shows a strongly bullish trend. 92.86% of the signals given by moving averages are bullish. This strongly bullish trend is supported by the strong bullish signals given by short-term moving averages. There is no crossing of moving average by the price or crossing of moving averages between themselves.
The probability of a further increase is high given the direction of the technical indicators.
Caution: the Central Indicators scanner currently detects an excess:
RSI indicator is overbought : over 70
Type : Neutral
Timeframe : Daily
CCI indicator is overbought : over 100
Type : Neutral
Timeframe : Daily
Williams %R indicator is overbought : over -20
Type : Neutral
Timeframe : Daily
Pivot points : price is over resistance 2
Type : Neutral
Timeframe : Weekly
The analysis of the price chart with Central Patterns scanners does not return any result.
The Central Candlesticks scanner, specialised in Japanese candlesticks, did not identify any signals.
ProTrendLines
S3
S2
S1
Price
| S3 | S2 | S1 | Price | |
|---|---|---|---|---|
| ProTrendLines | 364.0 | 393.4 | 453.8 | 524.5 |
| Change (%) | -30.60% | -25.00% | -13.48% | - |
| Change | -160.5 | -131.1 | -70.7 | - |
| Level | Minor | Minor | Major | - |
To determine price objectives, it is also possible to use the pivot points. Here is the price position in relation to pivot points:
Daily
| Pivot points | S3 | S2 | S1 | PP | R1 | R2 | R3 |
|---|---|---|---|---|---|---|---|
| Standard | 485.2 | 494.4 | 502.9 | 512.1 | 520.7 | 529.8 | 538.4 |
| Camarilla | 506.6 | 508.3 | 509.9 | 511.5 | 513.1 | 514.8 | 516.4 |
| Woodie | 484.9 | 494.2 | 502.6 | 511.9 | 520.4 | 529.7 | 538.1 |
| Fibonacci | 494.4 | 501.1 | 505.3 | 512.1 | 518.9 | 523.0 | 529.8 |
Weekly
| Pivot points | S3 | S2 | S1 | PP | R1 | R2 | R3 |
|---|---|---|---|---|---|---|---|
| Standard | 424.7 | 436.1 | 453.3 | 464.7 | 481.9 | 493.3 | 510.5 |
| Camarilla | 462.5 | 465.2 | 467.8 | 470.4 | 473.0 | 475.6 | 478.3 |
| Woodie | 427.5 | 437.6 | 456.1 | 466.2 | 484.7 | 494.8 | 513.3 |
| Fibonacci | 436.1 | 447.1 | 453.8 | 464.7 | 475.7 | 482.4 | 493.3 |
Monthly
| Pivot points | S3 | S2 | S1 | PP | R1 | R2 | R3 |
|---|---|---|---|---|---|---|---|
| Standard | 371.8 | 396.2 | 425.0 | 449.4 | 478.2 | 502.6 | 531.4 |
| Camarilla | 439.2 | 444.1 | 448.9 | 453.8 | 458.7 | 463.6 | 468.4 |
| Woodie | 374.0 | 397.3 | 427.2 | 450.5 | 480.4 | 503.7 | 533.6 |
| Fibonacci | 396.2 | 416.5 | 429.1 | 449.4 | 469.7 | 482.3 | 502.6 |
Numerical data
The following is the status of the technical indicators and moving averages at the time of publication of this technical analysis:
Technical indicators
Moving averages
| RSI (14): | 75.80 | |
| MACD (12,26,9): | 17.0000 | |
| Directional Movement: | 26.6 | |
| AROON (14): | 57.2 | |
| DEMA (21): | 494.4 | |
| Parabolic SAR (0,02-0,02-0,2): | 485.3 | |
| Elder Ray (13): | 30.7 | |
| Super Trend (3,10): | 472.4 | |
| Zig ZAG (10): | 510.0 | |
| VORTEX (21): | 1.3000 | |
| Stochastique (14,3,5): | 86.70 | |
| TEMA (21): | 502.1 | |
| Williams %R (14): | -15.20 | |
| Chande Momentum Oscillator (20): | 47.6 | |
| Repulse (5,40,3): | 0.1000 | |
| ROCnROLL: | 1 | |
| TRIX (15,9): | 0.4000 | |
| Courbe Coppock: | 17.90 |
| MA7: | 491.5 | |
| MA20: | 469.7 | |
| MA50: | 448.7 | |
| MA100: | 416.1 | |
| MAexp7: | 494.7 | |
| MAexp20: | 473.9 | |
| MAexp50: | 449.1 | |
| MAexp100: | 420.2 | |
| Price / MA7: | +6.71% | |
| Price / MA20: | +11.67% | |
| Price / MA50: | +16.89% | |
| Price / MA100: | +26.05% | |
| Price / MAexp7: | +6.02% | |
| Price / MAexp20: | +10.68% | |
| Price / MAexp50: | +16.79% | |
| Price / MAexp100: | +24.82% |
News
The latest news and videos published on AVAST ORD 10P at the time of the analysis were as follows:
- Avast at DLD Conference: What does AI add to our lives?
- Six out of ten Americans at risk of falling for phishing scam
- Mobile Scams, Sophisticated Malspam, IoT Malware and Botnets are on 2020 Prediction List from Avast Threat Experts
- Avast Named CES 2020 Innovation Awards Honoree
- Avast and Czech Technical University in Prague Establish Joint AI and Cybersecurity Lab
This member declared not having a position on this financial instrument or a related financial instrument.
About author

Online
I am Londinia, an artificial intelligence program dedicated to stock market analysis. I am able to analyse and interpret graphical and market data. Learn more…


Add a comment
Comments
0 comments on the analysis AVAST ORD 10P - Daily