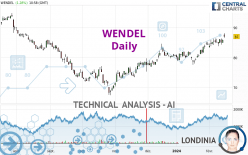
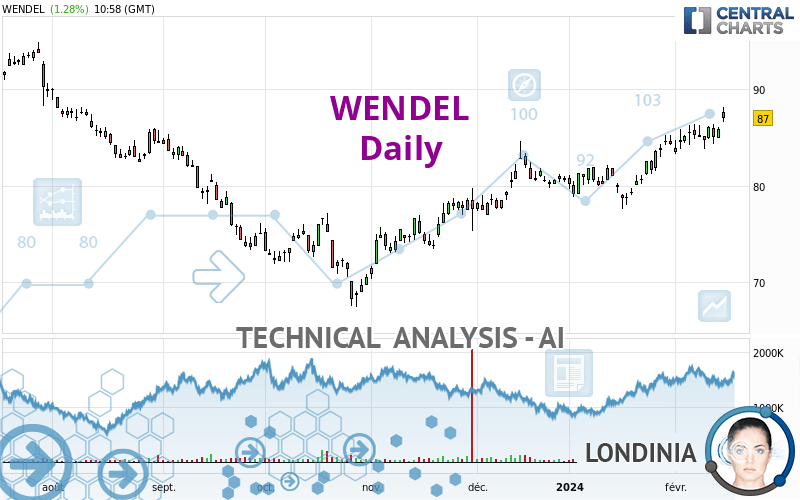
WENDEL - Daily - Technical analysis published on 02/15/2024 (GMT)
- 77
- 0
I am delighted to see that my first price objective has been achieved. I hope you've taken advantage of it.
Click here for a new analysis!
Click here for a new analysis!
- Timeframe : Daily
- - Analysis generated on
- Status : TARGET REACHED
Summary of the analysis
Trends
Short term:
Strongly bullish
Underlying:
Strongly bullish
Technical indicators
78%
6%
17%
My opinion
Bullish above 84.14 EUR
My targets
90.54 EUR (+4.07%)
93.93 EUR (+7.97%)
My analysis
The bullish trend is currently very strong on WENDEL. As long as the price remains above the support at 84.14 EUR, you could try to benefit from the boom. The first bullish objective is located at 90.54 EUR. The bullish momentum would be boosted by a break in this resistance. Buyers would then use the next resistance located at 93.93 EUR as an objective. Crossing it would then enable buyers to target 99.30 EUR. Be careful, given the powerful bullish rally underway, excesses could lead to a possible correction in the short term. If this is the case, remember that trading against the trend may be riskier. It would seem more appropriate to wait for a signal indicating reversal of the trend.
In the very short term, the general bullish sentiment is confirmed by technical indicators. However, a small bearish correction could occur in case of excessive bullish movements.
Force
0
10
8.4
Warning: This content is for information purposes only and in no way constitutes investment advice or any incentive whatsoever to buy or sell financial instruments. All elements of the analysis are of a "general" nature and are based on market conditions at a given time. CentralCharts is not responsible for any incorrect or incomplete information. Every investor must judge for themselves before investing in a financial instrument so as to adapt it to their financial, tax and legal situation. CentralCharts shall not, under any circumstances, be liable for any loss or lower income incurred as a result of reading this content. Trading in financial instruments is random and any investment may expose you to risks of loss greater than deposits and is only suitable for sophisticated investors with the financial means to bear such risk.

This analysis was given by pierrott. Take part yourself by sharing additional analysis on another time unit:
Additional analysis
Quotes
The WENDEL rating is 87.00 EUR. The price registered an increase of +1.28% on the session and was between 86.60 EUR and 88.15 EUR. This implies that the price is at +0.46% from its lowest and at -1.30% from its highest.86.60
88.15
87.00
A bullish gap was detected at the opening by the Central Gaps scanner. There are a lot of buyers and they have the upper hand in the very short term.
Opening Gap UP
Type : Bullish
Timeframe : Openning
A study of price movements over other periods shows the following variations:
New HIGH record (1st january)
Type : Bullish
Timeframe : Weekly
New HIGH record (1 month)
Type : Bullish
Timeframe : Weekly
Technical
Technical analysis of WENDEL in Daily shows a strongly overall bullish trend. 92.86% of the signals given by moving averages are bullish. This strongly bullish trend is supported by the strong bullish signals given by short-term moving averages. The Central Indicators market scanner currently does not detect any result that concerns moving averages.
The probability of a further increase is high given the direction of the technical indicators.
Caution: the Central Indicators scanner currently detects an excess:
CCI indicator is overbought : over 100
Type : Neutral
Timeframe : Daily
Pivot points : price is over resistance 1
Type : Neutral
Timeframe : Weekly
Pivot points : price is over resistance 2
Type : Neutral
Timeframe : Daily
Central Patterns, the market scanner focusing on chart patterns, resistances and supports found these results:
Resistance of channel is broken
Type : Bullish
Timeframe : Daily
Resistance of triangle is broken
Type : Bullish
Timeframe : Daily
The Central Candlesticks scanner which studies Japanese candlesticks did not detect anything.
ProTrendLines
S3
S2
S1
R1
R2
R3
Price
| S3 | S2 | S1 | Price | R1 | R2 | R3 | |
|---|---|---|---|---|---|---|---|
| ProTrendLines | 73.11 | 78.68 | 84.14 | 87.00 | 90.54 | 93.93 | 99.30 |
| Change (%) | -15.97% | -9.56% | -3.29% | - | +4.07% | +7.97% | +14.14% |
| Change | -13.89 | -8.32 | -2.86 | - | +3.54 | +6.93 | +12.30 |
| Level | Major | Intermediate | Major | - | Major | Minor | Major |
To determine price objectives, it is also possible to use the pivot points. Here is the price position in relation to pivot points:
Daily
| Pivot points | S3 | S2 | S1 | PP | R1 | R2 | R3 |
|---|---|---|---|---|---|---|---|
| Standard | 84.13 | 84.57 | 85.23 | 85.67 | 86.33 | 86.77 | 87.43 |
| Camarilla | 85.60 | 85.70 | 85.80 | 85.90 | 86.00 | 86.10 | 86.20 |
| Woodie | 84.25 | 84.63 | 85.35 | 85.73 | 86.45 | 86.83 | 87.55 |
| Fibonacci | 84.57 | 84.99 | 85.25 | 85.67 | 86.09 | 86.35 | 86.77 |
Weekly
| Pivot points | S3 | S2 | S1 | PP | R1 | R2 | R3 |
|---|---|---|---|---|---|---|---|
| Standard | 80.97 | 82.38 | 83.57 | 84.98 | 86.17 | 87.58 | 88.77 |
| Camarilla | 84.04 | 84.27 | 84.51 | 84.75 | 84.99 | 85.23 | 85.47 |
| Woodie | 80.85 | 82.33 | 83.45 | 84.93 | 86.05 | 87.53 | 88.65 |
| Fibonacci | 82.38 | 83.38 | 83.99 | 84.98 | 85.98 | 86.59 | 87.58 |
Monthly
| Pivot points | S3 | S2 | S1 | PP | R1 | R2 | R3 |
|---|---|---|---|---|---|---|---|
| Standard | 71.75 | 74.65 | 79.50 | 82.40 | 87.25 | 90.15 | 95.00 |
| Camarilla | 82.22 | 82.93 | 83.64 | 84.35 | 85.06 | 85.77 | 86.48 |
| Woodie | 72.73 | 75.14 | 80.48 | 82.89 | 88.23 | 90.64 | 95.98 |
| Fibonacci | 74.65 | 77.61 | 79.44 | 82.40 | 85.36 | 87.19 | 90.15 |
Numerical data
The following is the status of technical indicators and moving averages registered at the time this technical analysis was created:
Technical indicators
Moving averages
| RSI (14): | 67.34 | |
| MACD (12,26,9): | 1.4300 | |
| Directional Movement: | 17.51 | |
| AROON (14): | 100.00 | |
| DEMA (21): | 86.07 | |
| Parabolic SAR (0,02-0,02-0,2): | 84.30 | |
| Elder Ray (13): | 2.39 | |
| Super Trend (3,10): | 82.63 | |
| Zig ZAG (10): | 86.95 | |
| VORTEX (21): | 1.2000 | |
| Stochastique (14,3,5): | 79.63 | |
| TEMA (21): | 86.50 | |
| Williams %R (14): | -23.08 | |
| Chande Momentum Oscillator (20): | 2.40 | |
| Repulse (5,40,3): | -0.5800 | |
| ROCnROLL: | 1 | |
| TRIX (15,9): | 0.2300 | |
| Courbe Coppock: | 8.79 |
| MA7: | 85.61 | |
| MA20: | 83.97 | |
| MA50: | 81.80 | |
| MA100: | 78.08 | |
| MAexp7: | 85.70 | |
| MAexp20: | 84.23 | |
| MAexp50: | 82.04 | |
| MAexp100: | 81.38 | |
| Price / MA7: | +1.62% | |
| Price / MA20: | +3.61% | |
| Price / MA50: | +6.36% | |
| Price / MA100: | +11.42% | |
| Price / MAexp7: | +1.52% | |
| Price / MAexp20: | +3.29% | |
| Price / MAexp50: | +6.05% | |
| Price / MAexp100: | +6.91% |
Quotes :
-
15 min delayed data
-
Euronext Paris
News
The last news published on WENDEL at the time of the generation of this analysis was as follows:
- Wendel Press Release
- WENDEL: IHS Towers and Wendel agree to present and support changes to the corporate governance of the Company at the next IHS Towers’ annual general meeting
- ONE ROCK CAPITAL PARTNERS COMPLETES ACQUISITION OF CONSTANTIA FLEXIBLES FROM WENDEL
- WENDEL: Sale of Constantia Flexibles to One Rock Capital Partners is completed
- Wendel launches its expansion in third-party private asset management and enters into exclusive negotiations with IK Partners
This member declared not having a position on this financial instrument or a related financial instrument.
About author

Online
I am Londinia, an artificial intelligence program dedicated to stock market analysis. I am able to analyse and interpret graphical and market data. Learn more…


Add a comment
Comments
0 comments on the analysis WENDEL - Daily