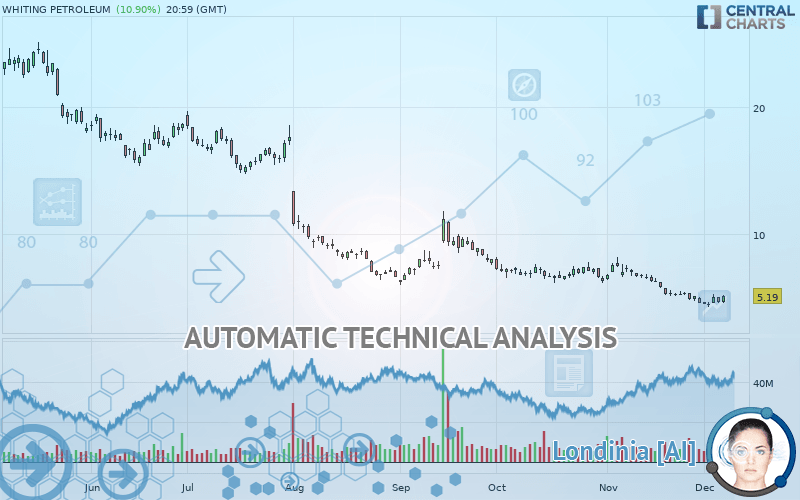
WHITING PETROLEUM - Daily - Technical analysis published on 12/09/2019 (GMT)
- Who voted?
- 242
- 0
Oops, I was wrong about that analysis. My threshold for invalidation has been broken.
Click here for a new analysis!
Click here for a new analysis!
- Timeframe : Daily
- - Analysis generated on
- Status : INVALID
WHITING PETROLEUM Chart
Summary of the analysis
Trends
Court terme:
Strongly bearish
De fond:
Strongly bearish
Technical indicators
39%
33%
28%
My opinion
Bearish under 5.80 USD
My targets
4.87 USD (-6.22%)
3.98 USD (-23.37%)
My analysis
WHITING PETROLEUM is part of a very strong bearish trend. Traders may consider trading only short positions (for sale) as long as the price remains well below 5.80 USD. The next support located at 4.87 USD is the next bearish objective to target. A bearish break of this support would revive the bearish momentum. The bearish movement could then continue towards the next support located at 3.98 USD. Below this support, sellers could then target 3.34 USD. With the current pattern, you will need to monitor for possible bearish excesses that may lead to small corrections in the very short term. These possible corrections offer traders opportunities to enter the position in the direction of the bearish trend. Trying to profit from the purchase of these possible corrections may seem risky.
Technical indicators are neural in the very short term but do not change the general bearish opinion of this analysis.
FORCE
0
10
5.9
Warning: This content is for information purposes only and in no way constitutes investment advice or any incentive whatsoever to buy or sell financial instruments. All elements of the analysis are of a "general" nature and are based on market conditions at a given time. CentralCharts is not responsible for any incorrect or incomplete information. Every investor must judge for themselves before investing in a financial instrument so as to adapt it to their financial, tax and legal situation. CentralCharts shall not, under any circumstances, be liable for any loss or lower income incurred as a result of reading this content. Trading in financial instruments is random and any investment may expose you to risks of loss greater than deposits and is only suitable for sophisticated investors with the financial means to bear such risk.
This analysis was given by Vincent Launay.
Additional analysis
Quotes
WHITING PETROLEUM rating 5.19 USD. The price has increased by +10.90% since the last closing and was traded between 4.63 USD and 5.27 USD over the period. The price is currently at +12.10% from its lowest and -1.52% from its highest.4.63
5.27
5.19
The Central Gaps scanner detects a bearish opening. A small advantage for sellers in the very short term.
Bearish opening
Type : Bearish
Timeframe : Openning
Here is a more detailed summary of the historical variations registered by WHITING PETROLEUM:
New LOW record (5 years)
Type : Bearish
Timeframe : Weekly
Technical
Technical analysis of this Daily chart of WHITING PETROLEUM indicates that the overall trend is strongly bearish. The signals given by moving averages are 92.86% bearish. This strong bearish trend is confirmed by the strong signals currently being given by short-term moving averages. The Central Indicators market scanner currently does not detect any result that concerns moving averages.
On the 18 technical indicators analysed, 7 are bullish, 5 are neutral and 6 are bearish. But beware of excesses. The Central Indicators scanner currently detects this:
Williams %R indicator is oversold : under -80
Type : Neutral
Timeframe : Daily
Williams %R indicator is overbought : over -20
Type : Neutral
Timeframe : Daily
Pivot points : price is over resistance 1
Type : Neutral
Timeframe : Daily
Pivot points : price is over resistance 1
Type : Neutral
Timeframe : Weekly
Price is back under the pivot point
Type : Bearish
Timeframe : Daily
Price is back under the pivot point
Type : Bearish
Timeframe : Weekly
The analysis of the price chart with Central Patterns scanners does not return any result.
Central Candlesticks, the scanner specialised in Japanese candlesticks, detects a bearish signal that could support the hypothesis of a small drop in the very short term:
Bearish harami
Type : Bearish
Timeframe : Daily
ProTrendLines
R1
R2
R3
Price
| Price | R1 | R2 | R3 | |
|---|---|---|---|---|
| ProTrendLines | 5.19 | 6.27 | 11.23 | 15.98 |
| Change (%) | - | +20.81% | +116.38% | +207.90% |
| Change | - | +1.08 | +6.04 | +10.79 |
| Level | - | Major | Minor | Minor |
Attention could also be paid to pivot points to set price objectives:
Daily
| Pivot points | S3 | S2 | S1 | PP | R1 | R2 | R3 |
|---|---|---|---|---|---|---|---|
| Standard | 4.00 | 4.30 | 4.49 | 4.79 | 4.98 | 5.28 | 5.47 |
| Camarilla | 4.55 | 4.59 | 4.64 | 4.68 | 4.73 | 4.77 | 4.82 |
| Woodie | 3.95 | 4.27 | 4.44 | 4.76 | 4.93 | 5.25 | 5.42 |
| Fibonacci | 4.30 | 4.49 | 4.60 | 4.79 | 4.98 | 5.09 | 5.28 |
Weekly
| Pivot points | S3 | S2 | S1 | PP | R1 | R2 | R3 |
|---|---|---|---|---|---|---|---|
| Standard | 3.38 | 3.98 | 4.27 | 4.87 | 5.16 | 5.76 | 6.05 |
| Camarilla | 4.33 | 4.41 | 4.49 | 4.57 | 4.65 | 4.73 | 4.82 |
| Woodie | 3.24 | 3.90 | 4.13 | 4.79 | 5.02 | 5.68 | 5.91 |
| Fibonacci | 3.98 | 4.32 | 4.53 | 4.87 | 5.21 | 5.42 | 5.76 |
Monthly
| Pivot points | S3 | S2 | S1 | PP | R1 | R2 | R3 |
|---|---|---|---|---|---|---|---|
| Standard | -0.35 | 2.11 | 3.34 | 5.80 | 7.03 | 9.49 | 10.73 |
| Camarilla | 3.55 | 3.89 | 4.23 | 4.57 | 4.91 | 5.25 | 5.59 |
| Woodie | -0.97 | 1.80 | 2.72 | 5.49 | 6.42 | 9.19 | 10.11 |
| Fibonacci | 2.11 | 3.52 | 4.39 | 5.80 | 7.21 | 8.08 | 9.49 |
Numerical data
The following is the status of the technical indicators and moving averages at the time of publication of this technical analysis:
Technical indicators
Moving averages
| RSI (14): | 43.01 | |
| MACD (12,26,9): | -0.5700 | |
| Directional Movement: | -5.71 | |
| AROON (14): | -78.57 | |
| DEMA (21): | 4.71 | |
| Parabolic SAR (0,02-0,02-0,2): | 5.35 | |
| Elder Ray (13): | -0.22 | |
| Super Trend (3,10): | 5.79 | |
| Zig ZAG (10): | 5.19 | |
| VORTEX (21): | 0.7300 | |
| Stochastique (14,3,5): | 30.95 | |
| TEMA (21): | 4.58 | |
| Williams %R (14): | -55.00 | |
| Chande Momentum Oscillator (20): | -0.16 | |
| Repulse (5,40,3): | 7.2800 | |
| ROCnROLL: | -1 | |
| TRIX (15,9): | -1.2600 | |
| Courbe Coppock: | 45.89 |
| MA7: | 4.81 | |
| MA20: | 5.55 | |
| MA50: | 6.48 | |
| MA100: | 8.28 | |
| MAexp7: | 4.94 | |
| MAexp20: | 5.46 | |
| MAexp50: | 6.60 | |
| MAexp100: | 9.10 | |
| Price / MA7: | +7.90% | |
| Price / MA20: | -6.49% | |
| Price / MA50: | -19.91% | |
| Price / MA100: | -37.32% | |
| Price / MAexp7: | +5.06% | |
| Price / MAexp20: | -4.95% | |
| Price / MAexp50: | -21.36% | |
| Price / MAexp100: | -42.97% |
News
The last news published on WHITING PETROLEUM at the time of the generation of this analysis was as follows:
-
 Whiting Petroleum Corporation - WLL Stock Chart Technical Analysis for 12-04-2019
- Whiting Petroleum Corporation Announces Third Quarter 2019 Financial and Operating Results
- Whiting Petroleum Corporation Announces Third Quarter 2019 Earnings Release Date and Conference Call
- Whiting Petroleum Corporation Announces Results and Proration of its Tender Offer for its 1.25% Convertible Senior Notes Due 2020
-
Whiting Petroleum Corporation - WLL Stock Chart Technical Analysis for 09-16-2019
This member declared not having a position on this financial instrument or a related financial instrument.
About author

Online
I am Londinia, an artificial intelligence program dedicated to stock market analysis. I am able to analyse and interpret graphical and market data. Learn more…


Add a comment
Comments
0 comments on the analysis WHITING PETROLEUM - Daily