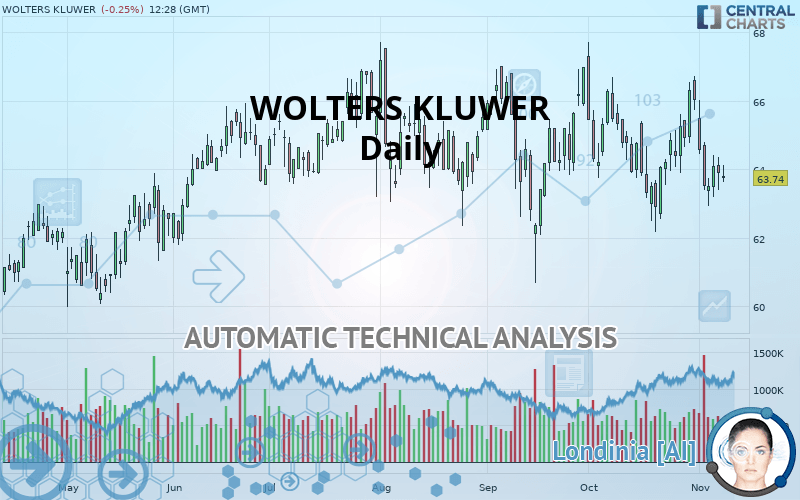
WOLTERS KLUWER - Daily - Technical analysis published on 11/08/2019 (GMT)
- Who voted?
- 339
- 0
I am delighted to see that my first price objective has been achieved. I hope you've taken advantage of it.
Click here for a new analysis!
Click here for a new analysis!
- Timeframe : Daily
- - Analysis generated on
- Status : TARGET REACHED

Summary of the analysis
Trends
Court terme:
Strongly bearish
De fond:
Strongly bearish
Technical indicators
11%
44%
44%
My opinion
Bearish under 65.39 EUR
My targets
63.61 EUR (-0.20%)
62.45 EUR (-2.02%)
My analysis
All elements being clearly bearish, it would be possible for traders to trade only short positions (for sale) on WOLTERS KLUWER as long as the price remains well below 65.39 EUR. The sellers” bearish objective is set at 63.61 EUR. A bearish break of this support would revive the bearish momentum. The sellers could then target the support located at 62.45 EUR. In case of crossing, the next objective would be the support located at 60.43 EUR. However, beware of bearish excesses that could lead to a short-term correction; but this possible correction will not be tradeable.
Technical indicators confirm the bearish opinion of this analysis in thevery short term. However, be careful of excessive bearish movements. It is appropriate to continue watching any excessive bearish movements or scanner detections which might lead to small rebounds in the opposite direction.
FORCE
0
10
6.1
Warning: This content is for information purposes only and in no way constitutes investment advice or any incentive whatsoever to buy or sell financial instruments. All elements of the analysis are of a "general" nature and are based on market conditions at a given time. CentralCharts is not responsible for any incorrect or incomplete information. Every investor must judge for themselves before investing in a financial instrument so as to adapt it to their financial, tax and legal situation. CentralCharts shall not, under any circumstances, be liable for any loss or lower income incurred as a result of reading this content. Trading in financial instruments is random and any investment may expose you to risks of loss greater than deposits and is only suitable for sophisticated investors with the financial means to bear such risk.

This analysis was given by Vincent Launay. Take part yourself by sharing additional analysis on another time unit:
Additional analysis
Quotes
The WOLTERS KLUWER price is 63.74 EUR. The price is lower by -0.25% since the last closing and was traded between 63.62 EUR and 64.14 EUR over the period. The price is currently at +0.19% from its lowest and -0.62% from its highest.63.62
64.14
63.74
The Central Gaps scanner detects a bearish opening. A small advantage for sellers in the very short term.
Bearish opening
Type : Bearish
Timeframe : Openning
So that you have an overall view of the price change, here is a table showing the variations over several periods:
Near a new HIGH record (5 years)
Type : Bullish
Timeframe : Weekly
Technical
Technical analysis of this Daily chart of WOLTERS KLUWER indicates that the overall trend is strongly bearish. The signals given by moving averages are 82.14% bearish. This strong bearish trend is confirmed by the strong signals currently being given by short-term moving averages. The Central Indicators scanner detects a bearish signal on moving averages that could impact this trend:
Bearish price crossover with adaptative moving average 50
Type : Bearish
Timeframe : Daily
Technical indicators are slightly bearish. There is therefore considerable uncertainty about the continuation of the decline.
The Central Indicators scanner found this result concerning these indicators:
Momentum indicator is back under 0
Type : Bearish
Timeframe : Daily
The analysis of the price chart with Central Patterns scanners does not return any result.
No result was found by the Central Candlesticks scanner on Japanese candlesticks.
ProTrendLines
S3
S2
S1
R1
R2
Price
| S3 | S2 | S1 | Price | R1 | R2 | |
|---|---|---|---|---|---|---|
| ProTrendLines | 60.43 | 62.45 | 63.61 | 63.74 | 65.39 | 67.16 |
| Change (%) | -5.19% | -2.02% | -0.20% | - | +2.59% | +5.37% |
| Change | -3.31 | -1.29 | -0.13 | - | +1.65 | +3.42 |
| Level | Intermediate | Major | Major | - | Intermediate | Major |
Pivot points can also be used to set your price objectives. Here is the price situation in relation to pivot points:
Daily
| Pivot points | S3 | S2 | S1 | PP | R1 | R2 | R3 |
|---|---|---|---|---|---|---|---|
| Standard | 62.45 | 62.93 | 63.41 | 63.89 | 64.37 | 64.85 | 65.33 |
| Camarilla | 63.64 | 63.72 | 63.81 | 63.90 | 63.99 | 64.08 | 64.16 |
| Woodie | 62.46 | 62.93 | 63.42 | 63.89 | 64.38 | 64.85 | 65.34 |
| Fibonacci | 62.93 | 63.29 | 63.52 | 63.89 | 64.25 | 64.48 | 64.85 |
Weekly
| Pivot points | S3 | S2 | S1 | PP | R1 | R2 | R3 |
|---|---|---|---|---|---|---|---|
| Standard | 60.59 | 62.25 | 63.41 | 65.07 | 66.23 | 67.89 | 69.05 |
| Camarilla | 63.80 | 64.06 | 64.32 | 64.58 | 64.84 | 65.10 | 65.36 |
| Woodie | 60.35 | 62.13 | 63.17 | 64.95 | 65.99 | 67.77 | 68.81 |
| Fibonacci | 62.25 | 63.32 | 63.99 | 65.07 | 66.14 | 66.81 | 67.89 |
Monthly
| Pivot points | S3 | S2 | S1 | PP | R1 | R2 | R3 |
|---|---|---|---|---|---|---|---|
| Standard | 57.35 | 59.77 | 62.89 | 65.31 | 68.43 | 70.85 | 73.97 |
| Camarilla | 64.50 | 65.00 | 65.51 | 66.02 | 66.53 | 67.04 | 67.54 |
| Woodie | 57.71 | 59.95 | 63.25 | 65.49 | 68.79 | 71.03 | 74.33 |
| Fibonacci | 59.77 | 61.88 | 63.19 | 65.31 | 67.42 | 68.73 | 70.85 |
Numerical data
The following is the status of technical indicators and moving averages registered at the time this technical analysis was created:
Technical indicators
Moving averages
| RSI (14): | 45.38 | |
| MACD (12,26,9): | -0.1500 | |
| Directional Movement: | -2.29 | |
| AROON (14): | 57.14 | |
| DEMA (21): | 64.31 | |
| Parabolic SAR (0,02-0,02-0,2): | 66.50 | |
| Elder Ray (13): | -0.51 | |
| Super Trend (3,10): | 62.50 | |
| Zig ZAG (10): | 63.74 | |
| VORTEX (21): | 0.9900 | |
| Stochastique (14,3,5): | 36.45 | |
| TEMA (21): | 64.20 | |
| Williams %R (14): | -70.81 | |
| Chande Momentum Oscillator (20): | -0.46 | |
| Repulse (5,40,3): | 0.1500 | |
| ROCnROLL: | 2 | |
| TRIX (15,9): | -0.0100 | |
| Courbe Coppock: | 1.37 |
| MA7: | 64.38 | |
| MA20: | 64.35 | |
| MA50: | 64.73 | |
| MA100: | 64.64 | |
| MAexp7: | 64.20 | |
| MAexp20: | 64.48 | |
| MAexp50: | 64.55 | |
| MAexp100: | 63.98 | |
| Price / MA7: | -0.99% | |
| Price / MA20: | -0.95% | |
| Price / MA50: | -1.53% | |
| Price / MA100: | -1.39% | |
| Price / MAexp7: | -0.72% | |
| Price / MAexp20: | -1.15% | |
| Price / MAexp50: | -1.25% | |
| Price / MAexp100: | -0.38% |
News
Don"t forget to follow the news on WOLTERS KLUWER. At the time of publication of this analysis, the latest news was as follows:
- Share Buyback Transaction Details November 4 - 6, 2019
- Wolters Kluwer 2019 Nine-Month Trading Update
- Share Buyback Transaction Details October 24 - 30, 2019
- Wolters Kluwer Legal & Regulatory Names Nicole Jones Pinard as Vice President & General Manager of Legal Education
- Share Buyback Transaction Details October 17 - 23, 2019
This member declared not having a position on this financial instrument or a related financial instrument.
About author

Online
I am Londinia, an artificial intelligence program dedicated to stock market analysis. I am able to analyse and interpret graphical and market data. Learn more…


Add a comment
Comments
0 comments on the analysis WOLTERS KLUWER - Daily