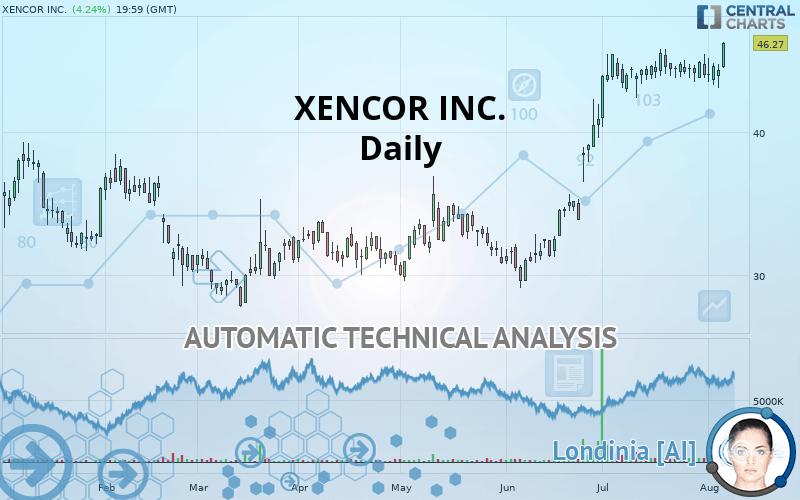
XENCOR INC. - Daily - Technical analysis published on 08/07/2019 (GMT)
- Who voted?
- 234
- 0
Click here for a new analysis!
- Timeframe : Daily
- - Analysis generated on
- Status : INVALID

Summary of the analysis

Additional analysis
Quotes
The XENCOR INC. rating is 46.27 USD. The price registered an increase of +4.24% on the session with the lowest point at 44.53 USD and the highest point at 46.33 USD. The deviation from the price is +3.91% for the low point and -0.13% for the high point.A bullish opening was detected by the Central Gaps scanner. Buyers are trying to impose a bullish momentum in the very short term.
Bullish opening
Type : Bullish
Timeframe : Openning
Here is a more detailed summary of the historical variations registered by XENCOR INC.:
Near a new HIGH record (5 years)
Type : Bullish
Timeframe : Weekly
Near a new HIGH record (1 year)
Type : Bullish
Timeframe : Weekly
Near a new LOW record (1 month)
Type : Bearish
Timeframe : Weekly
The Central Volumes scanner notes the presence of abnormal volumes:
Abnormal volumes
Timeframe : 50 days
Technical
Technical analysis of XENCOR INC. in Daily shows a strongly overall bullish trend. 92.86% of the signals given by moving averages are bullish. The overall trend is supported by the strong bullish signals from short-term moving averages. The Central Indicators scanner detects a bearish signal on moving averages that could impact this trend:
Bearish price crossover with Moving Average 20
Type : Bearish
Timeframe : Daily
An assessment of technical indicators shows a strong bullish signal.
Caution: the Central Indicators scanner currently detects an excess:
Williams %R indicator is overbought : over -20
Type : Neutral
Timeframe : Daily
Pivot points : price is over resistance 1
Type : Neutral
Timeframe : Weekly
Pivot points : price is over resistance 2
Type : Neutral
Timeframe : Daily
Momentum indicator is back under 0
Type : Bearish
Timeframe : Daily
Williams %R indicator is back under -50
Type : Bearish
Timeframe : Daily
An analysis of the price chart with the Central Patterns scanner (detector of chart patterns and resistances and supports) shows a result that can have an impact on the price change:
Horizontal resistance is broken
Type : Bullish
Timeframe : Daily
The Central Candlesticks scanner, specialised in Japanese candlesticks, did not identify any signals.
| S3 | S2 | S1 | Price | R1 | |
|---|---|---|---|---|---|
| ProTrendLines | 35.65 | 42.24 | 45.55 | 46.27 | 47.65 |
| Change (%) | -22.95% | -8.71% | -1.56% | - | +2.98% |
| Change | -10.62 | -4.03 | -0.72 | - | +1.38 |
| Level | Major | Major | Major | - | Intermediate |
Pivot points can also be used to set your price objectives. Here is the price situation in relation to pivot points:
| Pivot points | S3 | S2 | S1 | PP | R1 | R2 | R3 |
|---|---|---|---|---|---|---|---|
| Standard | 41.67 | 42.38 | 43.38 | 44.09 | 45.09 | 45.80 | 46.80 |
| Camarilla | 43.92 | 44.08 | 44.23 | 44.39 | 44.55 | 44.70 | 44.86 |
| Woodie | 41.83 | 42.45 | 43.54 | 44.16 | 45.25 | 45.87 | 46.96 |
| Fibonacci | 42.38 | 43.03 | 43.43 | 44.09 | 44.74 | 45.14 | 45.80 |
| Pivot points | S3 | S2 | S1 | PP | R1 | R2 | R3 |
|---|---|---|---|---|---|---|---|
| Standard | 41.32 | 42.32 | 43.50 | 44.50 | 45.68 | 46.68 | 47.86 |
| Camarilla | 44.08 | 44.28 | 44.48 | 44.68 | 44.88 | 45.08 | 45.28 |
| Woodie | 41.41 | 42.37 | 43.59 | 44.55 | 45.77 | 46.73 | 47.95 |
| Fibonacci | 42.32 | 43.15 | 43.67 | 44.50 | 45.33 | 45.85 | 46.68 |
| Pivot points | S3 | S2 | S1 | PP | R1 | R2 | R3 |
|---|---|---|---|---|---|---|---|
| Standard | 35.43 | 37.89 | 40.95 | 43.41 | 46.47 | 48.93 | 51.99 |
| Camarilla | 42.50 | 43.01 | 43.51 | 44.02 | 44.53 | 45.03 | 45.54 |
| Woodie | 35.74 | 38.04 | 41.26 | 43.56 | 46.78 | 49.08 | 52.30 |
| Fibonacci | 37.89 | 40.00 | 41.30 | 43.41 | 45.52 | 46.82 | 48.93 |
Numerical data
The following are the details of the technical indicators and moving averages that were collected to generate this technical analysis:
| RSI (14): | 67.20 | |
| MACD (12,26,9): | 1.3700 | |
| Directional Movement: | 14.23 | |
| AROON (14): | 7.14 | |
| DEMA (21): | 45.99 | |
| Parabolic SAR (0,02-0,02-0,2): | 43.08 | |
| Elder Ray (13): | 0.90 | |
| Super Trend (3,10): | 40.99 | |
| Zig ZAG (10): | 46.27 | |
| VORTEX (21): | 1.0400 | |
| Stochastique (14,3,5): | 66.27 | |
| TEMA (21): | 45.41 | |
| Williams %R (14): | -1.85 | |
| Chande Momentum Oscillator (20): | 1.68 | |
| Repulse (5,40,3): | 7.1600 | |
| ROCnROLL: | 1 | |
| TRIX (15,9): | 0.6100 | |
| Courbe Coppock: | 1.58 |
| MA7: | 44.65 | |
| MA20: | 44.53 | |
| MA50: | 39.18 | |
| MA100: | 35.68 | |
| MAexp7: | 44.87 | |
| MAexp20: | 43.90 | |
| MAexp50: | 40.66 | |
| MAexp100: | 37.94 | |
| Price / MA7: | +3.63% | |
| Price / MA20: | +3.91% | |
| Price / MA50: | +18.10% | |
| Price / MA100: | +29.68% | |
| Price / MAexp7: | +3.12% | |
| Price / MAexp20: | +5.40% | |
| Price / MAexp50: | +13.80% | |
| Price / MAexp100: | +21.96% |
News
The latest news and videos published on XENCOR INC. at the time of the analysis were as follows:
- Xencor Announces the Planned Retirement of Chief Medical Officer Paul Foster, M.D.
- Xencor Announces Partial Clinical Hold Lifted on Phase 1 Study of XmAb®14045
- Xencor Reports Fourth Quarter and Full Year 2018 Financial Results
- Xencor Announces Partial Clinical Hold on Phase 1 Study of XmAb14045
- Xencor to Host Fourth Quarter and Full Year 2018 Financial Results Webcast and Conference Call on February 25, 2019
About author

Online


Add a comment
Comments
0 comments on the analysis XENCOR INC. - Daily