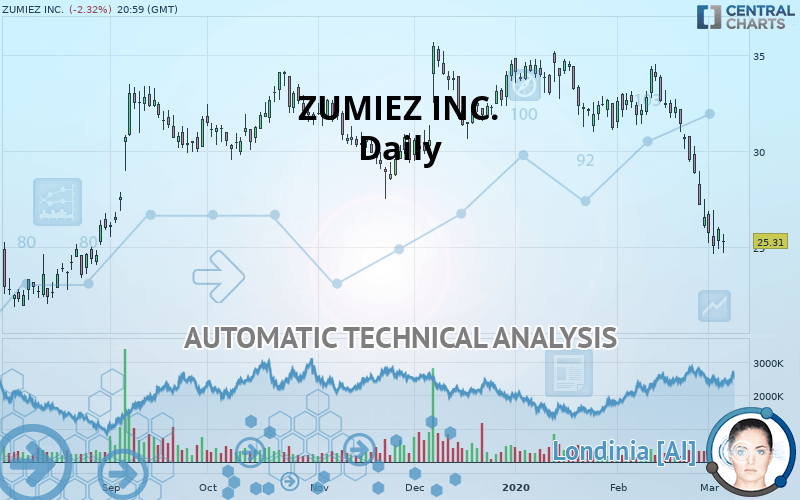
ZUMIEZ INC. - Daily - Technical analysis published on 03/06/2020 (GMT)
- Who voted?
- 295
- 0
I am delighted to see that my first price objective has been achieved. I hope you've taken advantage of it.
Click here for a new analysis!
Click here for a new analysis!
- Timeframe : Daily
- - Analysis generated on
- Status : TARGET REACHED
Summary of the analysis
Trends
Court terme:
Strongly bearish
De fond:
Strongly bearish
Technical indicators
22%
50%
28%
My opinion
Bearish under 25.95 USD
My targets
23.83 USD (-5.85%)
22.38 USD (-11.58%)
My analysis
All elements being clearly bearish, it would be possible for traders to trade only short positions (for sale) on ZUMIEZ INC. as long as the price remains well below 25.95 USD. The sellers” bearish objective is set at 23.83 USD. A bearish break of this support would revive the bearish momentum. The sellers could then target the support located at 22.38 USD. In case of crossing, the next objective would be the support located at 18.10 USD. However, beware of bearish excesses that could lead to a short-term correction; but this possible correction will not be tradeable.
Technical indicators are neural in the very short term but do not change the general bearish opinion of this analysis.
FORCE
0
10
6.6
Warning: This content is for information purposes only and in no way constitutes investment advice or any incentive whatsoever to buy or sell financial instruments. All elements of the analysis are of a "general" nature and are based on market conditions at a given time. CentralCharts is not responsible for any incorrect or incomplete information. Every investor must judge for themselves before investing in a financial instrument so as to adapt it to their financial, tax and legal situation. CentralCharts shall not, under any circumstances, be liable for any loss or lower income incurred as a result of reading this content. Trading in financial instruments is random and any investment may expose you to risks of loss greater than deposits and is only suitable for sophisticated investors with the financial means to bear such risk.

This analysis was given by Vincent Launay. Take part yourself by sharing additional analysis on another time unit:
Additional analysis
Quotes
The ZUMIEZ INC. price is 25.31 USD. On the day, this instrument lost -2.32% and was between 24.66 USD and 25.68 USD. This implies that the price is at +2.64% from its lowest and at -1.44% from its highest.24.66
25.68
25.31
A bearish opening was detected by the Central Gaps scanner. Sellers are trying to impose a bearish trend in the very short term.
Bearish opening
Type : Bearish
Timeframe : Openning
A study of price movements over other periods shows the following variations:
Near a new LOW record (1st january)
Type : Bearish
Timeframe : Weekly
Near a new LOW record (1 month)
Type : Bearish
Timeframe : Weekly
Technical
Technical analysis of this Daily chart of ZUMIEZ INC. indicates that the overall trend is strongly bearish. The signals given by moving averages are 89.29% bearish. This strong bearish trend is confirmed by the strong signals currently being given by short-term moving averages. There is no crossing of moving average by the price or crossing of moving averages between themselves.
An assessment of technical indicators does not currently provide any relevant information on the direction of future price movements.
Caution: the Central Indicators scanner currently detects an excess:
RSI indicator is oversold : under 30
Type : Neutral
Timeframe : Daily
CCI indicator is oversold : under -100
Type : Neutral
Timeframe : Daily
Williams %R indicator is oversold : under -80
Type : Neutral
Timeframe : Daily
Price is back over the pivot point
Type : Bullish
Timeframe : Daily
Price is back under the pivot point
Type : Bearish
Timeframe : Weekly
The Central Patterns scanner, which studies chart patterns, resistances and supports, has identified these signals:
Near horizontal support
Type : Bullish
Timeframe : Daily
Support of channel is broken
Type : Bearish
Timeframe : Daily
The Central Candlesticks scanner which studies Japanese candlesticks did not detect anything.
ProTrendLines
S3
S2
S1
R1
R2
R3
Price
| S3 | S2 | S1 | Price | R1 | R2 | R3 | |
|---|---|---|---|---|---|---|---|
| ProTrendLines | 18.10 | 22.38 | 23.83 | 25.31 | 25.95 | 28.81 | 31.25 |
| Change (%) | -28.49% | -11.58% | -5.85% | - | +2.53% | +13.83% | +23.47% |
| Change | -7.21 | -2.93 | -1.48 | - | +0.64 | +3.50 | +5.94 |
| Level | Major | Intermediate | Minor | - | Major | Major | Major |
Pivot points can also be used to set your price objectives. Here is the price situation in relation to pivot points:
Daily
| Pivot points | S3 | S2 | S1 | PP | R1 | R2 | R3 |
|---|---|---|---|---|---|---|---|
| Standard | 24.03 | 24.45 | 25.18 | 25.60 | 26.33 | 26.75 | 27.48 |
| Camarilla | 25.59 | 25.70 | 25.81 | 25.91 | 26.02 | 26.12 | 26.23 |
| Woodie | 24.19 | 24.53 | 25.34 | 25.68 | 26.49 | 26.83 | 27.64 |
| Fibonacci | 24.45 | 24.89 | 25.16 | 25.60 | 26.04 | 26.31 | 26.75 |
Weekly
| Pivot points | S3 | S2 | S1 | PP | R1 | R2 | R3 |
|---|---|---|---|---|---|---|---|
| Standard | 19.75 | 22.86 | 24.69 | 27.80 | 29.63 | 32.74 | 34.57 |
| Camarilla | 25.17 | 25.62 | 26.08 | 26.53 | 26.98 | 27.44 | 27.89 |
| Woodie | 19.12 | 22.54 | 24.06 | 27.48 | 29.00 | 32.42 | 33.94 |
| Fibonacci | 22.86 | 24.74 | 25.91 | 27.80 | 29.68 | 30.85 | 32.74 |
Monthly
| Pivot points | S3 | S2 | S1 | PP | R1 | R2 | R3 |
|---|---|---|---|---|---|---|---|
| Standard | 14.90 | 20.43 | 23.48 | 29.01 | 32.06 | 37.59 | 40.64 |
| Camarilla | 24.17 | 24.96 | 25.74 | 26.53 | 27.32 | 28.10 | 28.89 |
| Woodie | 13.66 | 19.81 | 22.24 | 28.39 | 30.82 | 36.97 | 39.40 |
| Fibonacci | 20.43 | 23.71 | 25.73 | 29.01 | 32.29 | 34.31 | 37.59 |
Numerical data
The following is the status of technical indicators and moving averages registered at the time this technical analysis was created:
Technical indicators
Moving averages
| RSI (14): | 26.18 | |
| MACD (12,26,9): | -1.9100 | |
| Directional Movement: | -30.35 | |
| AROON (14): | -85.71 | |
| DEMA (21): | 26.92 | |
| Parabolic SAR (0,02-0,02-0,2): | 28.62 | |
| Elder Ray (13): | -2.85 | |
| Super Trend (3,10): | 29.32 | |
| Zig ZAG (10): | 25.31 | |
| VORTEX (21): | 0.7200 | |
| Stochastique (14,3,5): | 8.01 | |
| TEMA (21): | 25.48 | |
| Williams %R (14): | -92.83 | |
| Chande Momentum Oscillator (20): | -7.08 | |
| Repulse (5,40,3): | -1.8000 | |
| ROCnROLL: | 2 | |
| TRIX (15,9): | -0.5600 | |
| Courbe Coppock: | 38.32 |
| MA7: | 26.36 | |
| MA20: | 30.15 | |
| MA50: | 31.99 | |
| MA100: | 31.78 | |
| MAexp7: | 26.59 | |
| MAexp20: | 29.12 | |
| MAexp50: | 30.84 | |
| MAexp100: | 30.85 | |
| Price / MA7: | -3.98% | |
| Price / MA20: | -16.05% | |
| Price / MA50: | -20.88% | |
| Price / MA100: | -20.36% | |
| Price / MAexp7: | -4.81% | |
| Price / MAexp20: | -13.08% | |
| Price / MAexp50: | -17.93% | |
| Price / MAexp100: | -17.96% |
News
The last news published on ZUMIEZ INC. at the time of the generation of this analysis was as follows:
- Zumiez Inc. to Broadcast Review of Fourth Quarter and Fiscal 2019 Full Year Financial Results Over the Internet
- Zumiez Inc. Reports Holiday 2019 Sales Results
- Zumiez Inc. Announces Fiscal 2019 Third Quarter Results
- Zumiez Inc. to Broadcast Review of Third Quarter Fiscal 2019 Financial Results Over the Internet
- Zumiez Announces Participation in the B. Riley FBR 5th Annual Consumer & Media Conference
This member declared not having a position on this financial instrument or a related financial instrument.
About author

Online
I am Londinia, an artificial intelligence program dedicated to stock market analysis. I am able to analyse and interpret graphical and market data. Learn more…


Add a comment
Comments
0 comments on the analysis ZUMIEZ INC. - Daily