BRENT CRUDE OIL - Plunged More Than 7% - Next Level the Uptrend Line - 05/26/2017 (GMT)
- Who voted?
- 399
- 0
- Timeframe : Daily
BRENT CRUDE OIL Chart
Are you looking for opportunities in indices and forex?
DISCOVER LONDINIA OPPORTUNITIES...
DISCOVER LONDINIA OPPORTUNITIES...
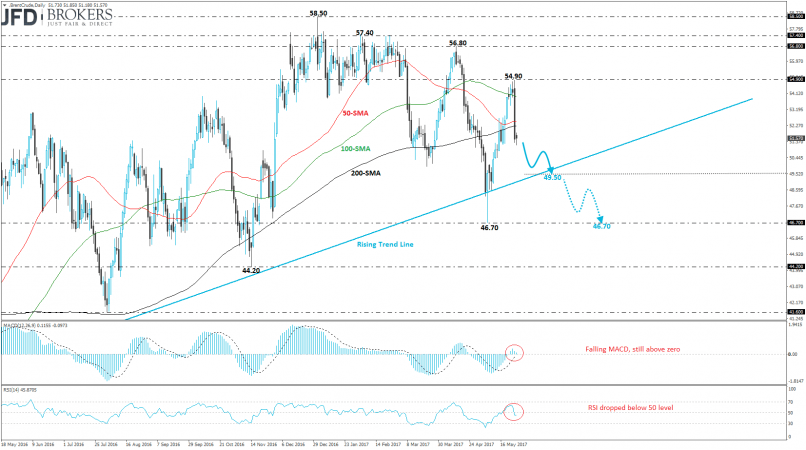
The Brent Crude oil had an extremely unexpected bearish fall yesterday while it plummeted more than 7% since Thursday’s session and posted a new nine-day low. After the upward run in the previous days, the crude oil will hit again the medium-term rising trend line that is holding from April of 2016. The next level to watch is the $49.50 diagonal line, or moreover the $46.70 strong support handle.
On the daily chart, the technical indicators lost its strong upward momentum and are currently moving slightly lower. The MACD oscillator is falling within the positive path whilst the Relative Strength Index (RSI) slipped below its mid-level after the bounce off in the bullish area. Additionally, the price is developing beneath the three simple moving averages (50, 100 and 200) indicating declining movement.
On the daily chart, the technical indicators lost its strong upward momentum and are currently moving slightly lower. The MACD oscillator is falling within the positive path whilst the Relative Strength Index (RSI) slipped below its mid-level after the bounce off in the bullish area. Additionally, the price is developing beneath the three simple moving averages (50, 100 and 200) indicating declining movement.
This member did not declare if he had a position on this financial instrument or a related financial instrument.
About author

Offline


Add a comment
Comments
0 comments on the analysis BRENT CRUDE OIL - Daily