BRENT CRUDE OIL - Remains In a Neutral Mode and Moves Sideways in $49.90 - $5 - 09/05/2017 (GMT)
- Who voted?
- 587
- 0
- Timeframe : Daily

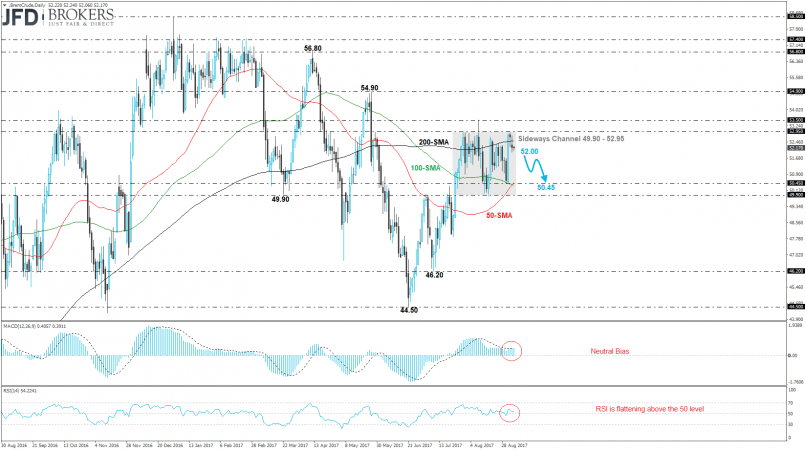
BRENT CRUDE OIL Chart
Are you looking for opportunities in indices and forex?
DISCOVER LONDINIA OPPORTUNITIES...
DISCOVER LONDINIA OPPORTUNITIES...
The Brent Crude oil posted a bullish to neutral month as it ended August near its opening level. Over the last five weeks, the price is developing within a consolidation area with upper boundary the $52.95 resistance level and lower boundary the $49.90 support barrier. During Friday’s session, the oil surged more than 4.5% and tried to hit again the aforementioned upper band. Currently, the price slipped beneath the 200-day SMA and is moving lower.
Furthermore, on the short-term chart, the 50 and 100 SMAs are ready to create a bullish crossover. Our prediction is a hit of the lower boundary of the sideways channel. MACD and RSI are holding in a bullish path but are moving with some weak momentum.
Furthermore, on the short-term chart, the 50 and 100 SMAs are ready to create a bullish crossover. Our prediction is a hit of the lower boundary of the sideways channel. MACD and RSI are holding in a bullish path but are moving with some weak momentum.
This member did not declare if he had a position on this financial instrument or a related financial instrument.
About author

Offline


Add a comment
Comments
0 comments on the analysis BRENT CRUDE OIL - Daily