WTI CRUDE OIL - Daily - Technical analysis published on 03/20/2021 (GMT)
- 211
- 0
Click here for a new analysis!
- Timeframe : Daily
- - Analysis generated on
- Status : INVALID
Summary of the analysis

Additional analysis
Quotes
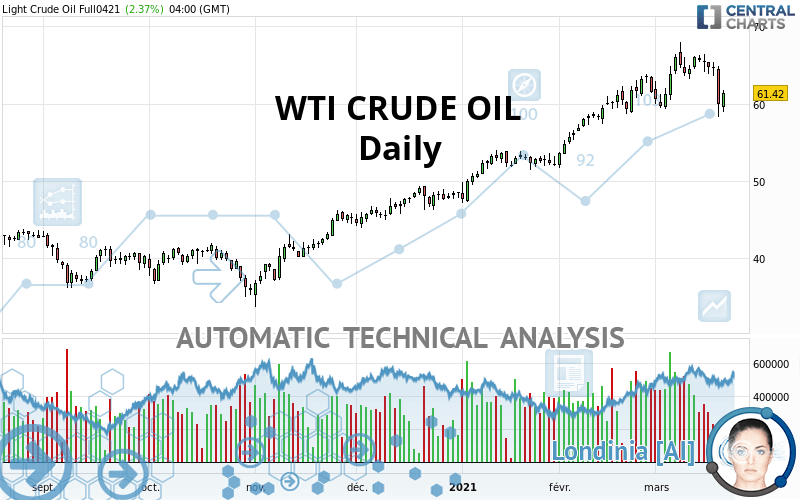
The WTI CRUDE OIL rating is 61.42 USD. The price registered an increase of +2.37% on the session and was between 58.94 USD and 61.72 USD. This implies that the price is at +4.21% from its lowest and at -0.49% from its highest.The Central Gaps scanner detects a bearish opening marking the presence of sellers ahead of buyers at the opening but not sufficiently marked to allow the price to register a quotation gap.
Bearish opening
Type : Bearish
Timeframe : Openning
So that you have an overall view of the price change, here is a table showing the variations over several periods:
Near a new LOW record (1 month)
Type : Bearish
Timeframe : Weekly
Technical
Technical analysis of WTI CRUDE OIL in Daily shows an overall bullish trend. 75.00% of the signals given by moving averages are bullish. Caution: the neutral signals currently given by the short-term moving averages indicate that this bullish trend is showing signs of running out of steam. The Central Indicators scanner detects bearish signals on moving averages that could impact this trend:
Bearish trend reversal : adaptative moving average 20
Type : Bearish
Timeframe : Daily
Bearish price crossover with Moving Average 20
Type : Bearish
Timeframe : Daily
Bearish price crossover with adaptative moving average 20
Type : Bearish
Timeframe : Daily
Bearish price crossover with adaptative moving average 50
Type : Bearish
Timeframe : Daily
Bearish price crossover with adaptative moving average 100
Type : Bearish
Timeframe : Daily
An assessment of technical indicators does not currently provide any relevant information on the direction of future price movements.
Caution: the Central Indicators scanner currently detects an excess:
CCI indicator: bearish divergence
Type : Bearish
Timeframe : Daily
Williams %R indicator is oversold : under -80
Type : Neutral
Timeframe : Daily
Pivot points : price is over resistance 3
Type : Neutral
Timeframe : Daily
Pivot points : price is under support 3
Type : Neutral
Timeframe : Daily
Pivot points : price is under support 3
Type : Neutral
Timeframe : Weekly
RSI indicator is back under 50
Type : Bearish
Timeframe : Daily
Parabolic SAR indicator bearish reversal
Type : Bearish
Timeframe : Daily
Price is back over the pivot point
Type : Bullish
Timeframe : Weekly
Williams %R indicator is back under -50
Type : Bearish
Timeframe : Daily
Central Patterns, the scanner specializing in chart patterns, did not identify any signals.
Central Candlesticks, the scanner specialised in Japanese candlesticks, detects a bearish signal that could support the hypothesis of a small drop in the very short term:
Long black line
Type : Bearish
Timeframe : Daily
| S3 | S2 | S1 | Price | R1 | R2 | R3 | |
|---|---|---|---|---|---|---|---|
| ProTrendLines | 51.10 | 53.52 | 59.75 | 61.42 | 63.20 | 66.08 | 76.38 |
| Change (%) | -16.80% | -12.86% | -2.72% | - | +2.90% | +7.59% | +24.36% |
| Change | -10.32 | -7.90 | -1.67 | - | +1.78 | +4.66 | +14.96 |
| Level | Major | Minor | Minor | - | Major | Major | Major |
Attention could also be paid to pivot points to set price objectives:
| Pivot points | S3 | S2 | S1 | PP | R1 | R2 | R3 |
|---|---|---|---|---|---|---|---|
| Standard | 50.57 | 54.39 | 57.19 | 61.01 | 63.81 | 67.63 | 70.43 |
| Camarilla | 58.18 | 58.79 | 59.39 | 60.00 | 60.61 | 61.21 | 61.82 |
| Woodie | 50.07 | 54.14 | 56.69 | 60.76 | 63.31 | 67.38 | 69.93 |
| Fibonacci | 54.39 | 56.92 | 58.48 | 61.01 | 63.54 | 65.10 | 67.63 |
| Pivot points | S3 | S2 | S1 | PP | R1 | R2 | R3 |
|---|---|---|---|---|---|---|---|
| Standard | 58.32 | 60.72 | 63.17 | 65.57 | 68.02 | 70.42 | 72.87 |
| Camarilla | 64.28 | 64.72 | 65.17 | 65.61 | 66.06 | 66.50 | 66.94 |
| Woodie | 58.34 | 60.73 | 63.19 | 65.58 | 68.04 | 70.43 | 72.89 |
| Fibonacci | 60.72 | 62.58 | 63.72 | 65.57 | 67.43 | 68.57 | 70.42 |
| Pivot points | S3 | S2 | S1 | PP | R1 | R2 | R3 |
|---|---|---|---|---|---|---|---|
| Standard | 44.43 | 48.94 | 54.79 | 59.30 | 65.15 | 69.66 | 75.51 |
| Camarilla | 57.79 | 58.74 | 59.69 | 60.64 | 61.59 | 62.54 | 63.49 |
| Woodie | 45.10 | 49.28 | 55.46 | 59.64 | 65.82 | 70.00 | 76.18 |
| Fibonacci | 48.94 | 52.90 | 55.34 | 59.30 | 63.26 | 65.70 | 69.66 |
Numerical data
The following is the status of the technical indicators and moving averages at the time of publication of this technical analysis:
| RSI (14): | 49.06 | |
| MACD (12,26,9): | 1.3300 | |
| Directional Movement: | -7.35 | |
| AROON (14): | -57.15 | |
| DEMA (21): | 64.75 | |
| Parabolic SAR (0,02-0,02-0,2): | 67.78 | |
| Elder Ray (13): | -2.86 | |
| Super Trend (3,10): | 59.39 | |
| Zig ZAG (10): | 61.48 | |
| VORTEX (21): | 0.9800 | |
| Stochastique (14,3,5): | 37.76 | |
| TEMA (21): | 63.94 | |
| Williams %R (14): | -66.46 | |
| Chande Momentum Oscillator (20): | 0.20 | |
| Repulse (5,40,3): | -0.7900 | |
| ROCnROLL: | -1 | |
| TRIX (15,9): | 0.4900 | |
| Courbe Coppock: | 6.07 |
| MA7: | 63.99 | |
| MA20: | 63.23 | |
| MA50: | 58.53 | |
| MA100: | 51.58 | |
| MAexp7: | 63.05 | |
| MAexp20: | 62.61 | |
| MAexp50: | 58.78 | |
| MAexp100: | 53.61 | |
| Price / MA7: | -4.02% | |
| Price / MA20: | -2.86% | |
| Price / MA50: | +4.94% | |
| Price / MA100: | +19.08% | |
| Price / MAexp7: | -2.59% | |
| Price / MAexp20: | -1.90% | |
| Price / MAexp50: | +4.49% | |
| Price / MAexp100: | +14.57% |
News
The latest news and videos published on WTI CRUDE OIL at the time of the analysis were as follows:
-
 WTI Crude Oil and USD/CAD Forecast March 22, 2021
-
WTI Crude Oil and USD/CAD Forecast March 19, 2021
-
WTI Crude Oil and USD/CAD Forecast March 18, 2021
-
WTI Crude Oil and USDCAD Forecast March 17, 2021
-
WTI Crude Oil Forecast March 16, 2021
About author

Online


Add a comment
Comments
0 comments on the analysis WTI CRUDE OIL - Daily