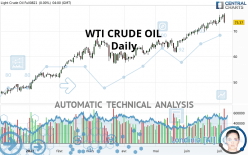
WTI CRUDE OIL - Daily - Technical analysis published on 07/06/2021 (GMT)
- 218
- 0
Click here for a new analysis!
- Timeframe : Daily
- - Analysis generated on
- Status : INVALID
Summary of the analysis

Additional analysis
Quotes
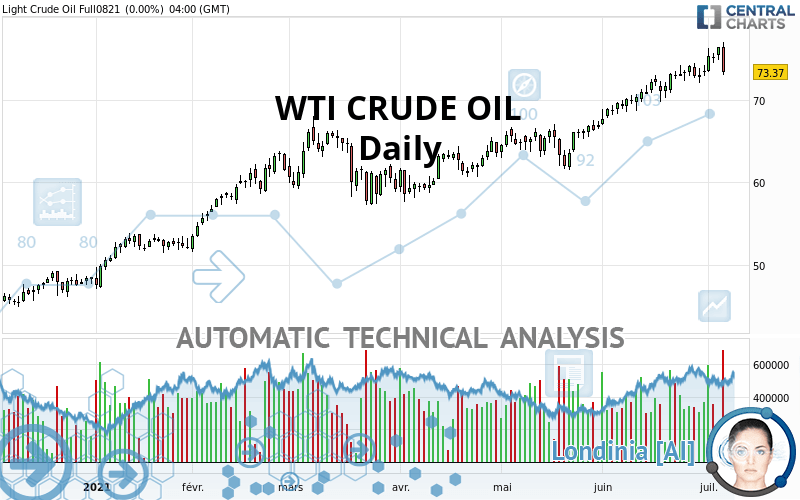
WTI CRUDE OIL rating 73.37 USD. The price has increased by +0.00% since the last closing and was between 72.94 USD and 76.98 USD. This implies that the price is at +0.59% from its lowest and at -4.69% from its highest.The Central Gaps scanner detects a bearish opening marking the presence of sellers ahead of buyers at the opening but not sufficiently marked to allow the price to register a quotation gap.
Bearish opening
Type : Bearish
Timeframe : Openning
A study of price movements over other periods shows the following variations:
New HIGH record (5 years)
Type : Bullish
Timeframe : Weekly
New HIGH record (1 year)
Type : Bullish
Timeframe : Weekly
New HIGH record (1st january)
Type : Bullish
Timeframe : Weekly
New HIGH record (1 month)
Type : Bullish
Timeframe : Weekly
Technical
Technical analysis of this Daily chart of WTI CRUDE OIL indicates that the overall trend is strongly bullish. The signals given by the moving averages are 92.86% bullish. This strong bullish trend is confirmed by the strong signals currently being given by short-term moving averages. There is no crossing of moving average by the price or crossing of moving averages between themselves.
The technical indicators are generally neutral. They do not provide relevant information on the direction of future price movements.
But beware of excesses. The Central Indicators scanner currently detects this:
Previous candle closed over Bollinger bands
Type : Neutral
Timeframe : Daily
RSI indicator: bearish divergence
Type : Bearish
Timeframe : Daily
Pivot points : price is under support 3
Type : Neutral
Timeframe : Daily
MACD crosses DOWN its Moving Average
Type : Bearish
Timeframe : Daily
Price is back over the pivot point
Type : Bullish
Timeframe : Daily
Price is back over the pivot point
Type : Bullish
Timeframe : Weekly
Central Patterns, the scanner specializing in chart patterns, did not identify any signals.
No result was found by the Central Candlesticks scanner on Japanese candlesticks.
| S3 | S2 | S1 | Price | R1 | R2 | R3 | |
|---|---|---|---|---|---|---|---|
| ProTrendLines | 51.10 | 63.20 | 66.12 | 73.37 | 76.38 | 98.47 | 110.38 |
| Change (%) | -30.35% | -13.86% | -9.88% | - | +4.10% | +34.21% | +50.44% |
| Change | -22.27 | -10.17 | -7.25 | - | +3.01 | +25.10 | +37.01 |
| Level | Intermediate | Major | Major | - | Major | Minor | Intermediate |
Attention could also be paid to pivot points to set price objectives:
| Pivot points | S3 | S2 | S1 | PP | R1 | R2 | R3 |
|---|---|---|---|---|---|---|---|
| Standard | 68.13 | 70.54 | 72.17 | 74.58 | 76.21 | 78.62 | 80.25 |
| Camarilla | 72.70 | 73.07 | 73.44 | 73.81 | 74.18 | 74.55 | 74.92 |
| Woodie | 67.75 | 70.35 | 71.79 | 74.39 | 75.83 | 78.43 | 79.87 |
| Fibonacci | 70.54 | 72.08 | 73.03 | 74.58 | 76.12 | 77.07 | 78.62 |
| Pivot points | S3 | S2 | S1 | PP | R1 | R2 | R3 |
|---|---|---|---|---|---|---|---|
| Standard | 68.43 | 70.20 | 72.68 | 74.45 | 76.93 | 78.70 | 81.18 |
| Camarilla | 73.99 | 74.38 | 74.77 | 75.16 | 75.55 | 75.94 | 76.33 |
| Woodie | 68.79 | 70.38 | 73.04 | 74.63 | 77.29 | 78.88 | 81.54 |
| Fibonacci | 70.20 | 71.82 | 72.83 | 74.45 | 76.07 | 77.08 | 78.70 |
| Pivot points | S3 | S2 | S1 | PP | R1 | R2 | R3 |
|---|---|---|---|---|---|---|---|
| Standard | 61.49 | 64.64 | 69.93 | 73.08 | 78.37 | 81.52 | 86.81 |
| Camarilla | 72.91 | 73.68 | 74.46 | 75.23 | 76.00 | 76.78 | 77.55 |
| Woodie | 62.57 | 65.18 | 71.01 | 73.62 | 79.45 | 82.06 | 87.89 |
| Fibonacci | 64.64 | 67.86 | 69.85 | 73.08 | 76.30 | 78.29 | 81.52 |
Numerical data
The following is the status of technical indicators and moving averages registered at the time this technical analysis was created:
| RSI (14): | 59.32 | |
| MACD (12,26,9): | 1.8600 | |
| Directional Movement: | 7.94 | |
| AROON (14): | 92.86 | |
| DEMA (21): | 75.19 | |
| Parabolic SAR (0,02-0,02-0,2): | 72.90 | |
| Elder Ray (13): | 1.34 | |
| Super Trend (3,10): | 70.53 | |
| Zig ZAG (10): | 73.81 | |
| VORTEX (21): | 1.1100 | |
| Stochastique (14,3,5): | 79.72 | |
| TEMA (21): | 75.44 | |
| Williams %R (14): | -43.97 | |
| Chande Momentum Oscillator (20): | 2.17 | |
| Repulse (5,40,3): | -2.0100 | |
| ROCnROLL: | 1 | |
| TRIX (15,9): | 0.4000 | |
| Courbe Coppock: | 8.76 |
| MA7: | 74.27 | |
| MA20: | 72.77 | |
| MA50: | 68.64 | |
| MA100: | 65.22 | |
| MAexp7: | 74.39 | |
| MAexp20: | 72.67 | |
| MAexp50: | 69.28 | |
| MAexp100: | 64.95 | |
| Price / MA7: | -1.21% | |
| Price / MA20: | +0.82% | |
| Price / MA50: | +6.89% | |
| Price / MA100: | +12.50% | |
| Price / MAexp7: | -1.37% | |
| Price / MAexp20: | +0.96% | |
| Price / MAexp50: | +5.90% | |
| Price / MAexp100: | +12.96% |
News
Don't forget to follow the news on WTI CRUDE OIL. At the time of publication of this analysis, the latest news was as follows:
-
 WTI Crude OIl and USD/CAD Forecast July 6, 2021
-
WTI Crude Oil Forecast July 5, 2021
-
WTI Crude Oil Forecast July 2, 2021
-
WTI Crude Oil Forecast July 1, 2021
-
WTI Crude Oil and USD/CAD Forecast June 30, 2021
About author

Online


Add a comment
Comments
0 comments on the analysis WTI CRUDE OIL - Daily