WTI CRUDE OIL - WTI Crude Oil Weekly Outlook - 07/18/2016 (GMT)
- Who voted?
- 562
- 0
- Timeframe : 4H
WTI CRUDE OIL Chart
Are you looking for opportunities in indices and forex?
DISCOVER LONDINIA OPPORTUNITIES...
DISCOVER LONDINIA OPPORTUNITIES...
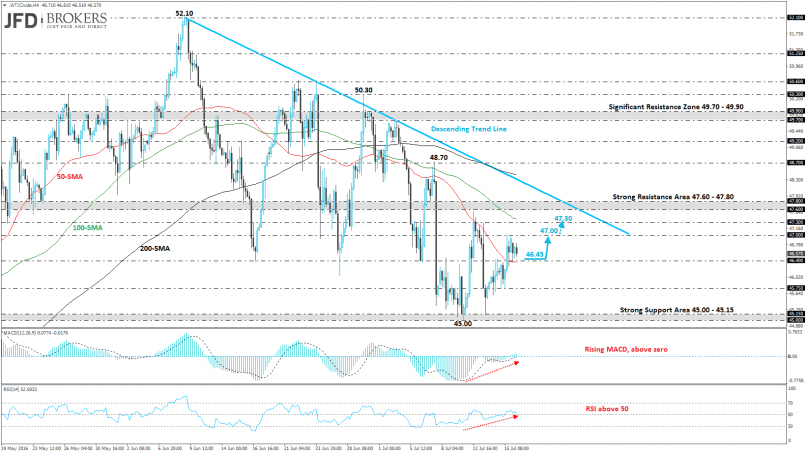
The WTI Crude Oil has been looking weak over the last couple of days after the failed attempt to settle above the $47.00 resistance level. The oil is moving well below the descending trend line and it has been developing below the aforementioned obstacle the last few days. From a technical point of view, on the 4-hour chart, the price is moving above the 50-SMA and the technical indicators entered into a positive territory. The MACD oscillator is rising above its mid-level and the RSI indicator is following a positive path, above 50 level. Our expectation is a rebound to the support level at $46.45 up to the $47.00 barrier or furthermore until the $47.30 which overlaps with the 100-SMA as well as with the descending trend line which started back in June. On the downside, the $45.75 and the critical level at $45.00 will be the next obstacles for the bears as at the moment these are the last 2 levels that support any bullish actions.
This member did not declare if he had a position on this financial instrument or a related financial instrument.
About author

Offline


Add a comment
Comments
0 comments on the analysis WTI CRUDE OIL - 4H