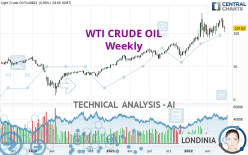
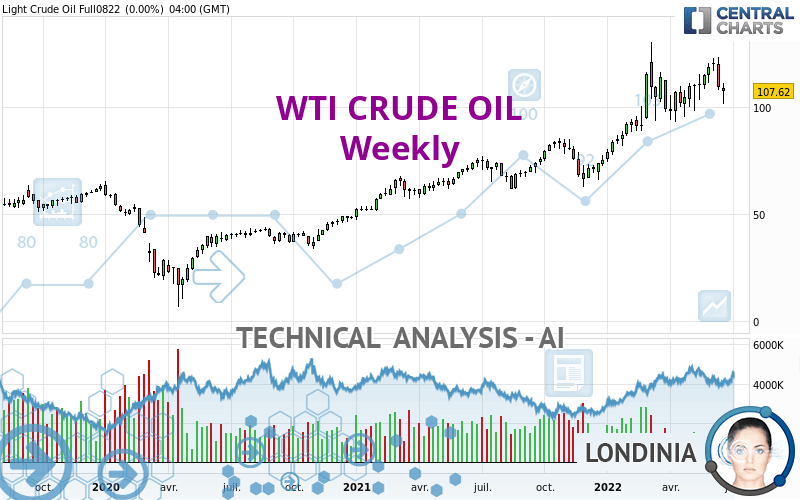
WTI CRUDE OIL - Weekly - Technical analysis published on 06/24/2022 (GMT)
- 190
- 0
Oops, I was wrong about that analysis. My threshold for invalidation has been broken.
Click here for a new analysis!
Click here for a new analysis!
- Timeframe : Weekly
- - Analysis generated on
- Status : INVALID
Summary of the analysis
Trends
Short term:
Strongly bullish
Underlying:
Strongly bullish
Technical indicators
44%
17%
39%
My opinion
Bullish above 104.58 USD
My targets
117.63 USD (+9.30%)
126.68 USD (+17.71%)
My analysis
WTI CRUDE OIL is part of a very strong bullish trend. Traders may consider trading only long positions (at the time of purchase) as long as the price remains well above 104.58 USD. The next resistance located at 117.63 USD is the next bullish objective to be reached. A bullish break in this resistance would boost the bullish momentum. The bullish movement could then continue towards the next resistance located at 126.68 USD. After this resistance, buyers could then target 197.78 USD. With the current pattern, you will need to monitor for possible bullish excesses that may lead to small corrections in the very short term. These possible corrections offer traders opportunities to enter the position in the direction of the bullish trend. Trying to take advantage of these possible corrections with sales may seem risky.
Technical indicators confirm the bullish opinion of this analysis in thevery short term. However, be careful of excessive bullish movements. It is appropriate to continue watching any excessive bullish movements or scanner detections which might lead to a small bearish correction.
Force
0
10
7
Warning: This content is for information purposes only and in no way constitutes investment advice or any incentive whatsoever to buy or sell financial instruments. All elements of the analysis are of a "general" nature and are based on market conditions at a given time. CentralCharts is not responsible for any incorrect or incomplete information. Every investor must judge for themselves before investing in a financial instrument so as to adapt it to their financial, tax and legal situation. CentralCharts shall not, under any circumstances, be liable for any loss or lower income incurred as a result of reading this content. Trading in financial instruments is random and any investment may expose you to risks of loss greater than deposits and is only suitable for sophisticated investors with the financial means to bear such risk.

This analysis was given by Gstar99. Take part yourself by sharing additional analysis on another time unit:
Additional analysis
Quotes
WTI CRUDE OIL rating 107.62 USD. The price registered a decrease of -1.77% over 5 days with the lowest point at 101.53 USD and the highest point at 111.16 USD. The deviation from the price is +6.00% for the low point and -3.18% for the high point.101.53
111.16
107.62
The Central Gaps scanner detects a bearish opening marking the presence of sellers ahead of buyers at the opening but not sufficiently marked to allow the price to register a quotation gap.
Bearish opening
Type : Bearish
Timeframe : Openning
A study of price movements over other periods shows the following variations:
Near a new LOW record (1 month)
Type : Bearish
Timeframe : Weekly
Technical
Technical analysis of WTI CRUDE OIL in Weekly shows a strongly overall bullish trend. The signals given by the moving averages are 92.86% bullish. This strong bullish trend is confirmed by the strong signals currently being given by short-term moving averages. The Central Indicators scanner does not detect any result on moving averages that would impact this trend.
In fact, according to the parameters integrated into the Central Analyzer system, only 8 technical indicators out of 18 analysed are currently bullish. Central Indicators, the scanner specialised in technical indicators, has identified these signals:
MACD crosses DOWN its Moving Average
Type : Bearish
Timeframe : Weekly
Aroon indicator bullish trend
Type : Bullish
Timeframe : Weekly
Momentum indicator is back over 0
Type : Bullish
Timeframe : Weekly
Central Patterns, the scanner specializing in chart patterns, did not identify any signals.
No result was found by the Central Candlesticks scanner on Japanese candlesticks.
ProTrendLines
S3
S2
S1
R1
R2
R3
Price
| S3 | S2 | S1 | Price | R1 | R2 | R3 | |
|---|---|---|---|---|---|---|---|
| ProTrendLines | 61.87 | 89.88 | 104.58 | 107.62 | 117.63 | 126.68 | 197.78 |
| Change (%) | -42.51% | -16.48% | -2.82% | - | +9.30% | +17.71% | +83.78% |
| Change | -45.75 | -17.74 | -3.04 | - | +10.01 | +19.06 | +90.16 |
| Level | Major | Minor | Major | - | Major | Minor | Intermediate |
Pivot points can also be used to set your price objectives. Here is the price situation in relation to pivot points:
Daily
| Pivot points | S3 | S2 | S1 | PP | R1 | R2 | R3 |
|---|---|---|---|---|---|---|---|
| Standard | 97.31 | 99.82 | 102.04 | 104.55 | 106.77 | 109.28 | 111.50 |
| Camarilla | 102.97 | 103.40 | 103.84 | 104.27 | 104.70 | 105.14 | 105.57 |
| Woodie | 97.18 | 99.75 | 101.91 | 104.48 | 106.64 | 109.21 | 111.37 |
| Fibonacci | 99.82 | 101.62 | 102.74 | 104.55 | 106.35 | 107.47 | 109.28 |
Weekly
| Pivot points | S3 | S2 | S1 | PP | R1 | R2 | R3 |
|---|---|---|---|---|---|---|---|
| Standard | 87.07 | 96.92 | 102.50 | 112.35 | 117.93 | 127.78 | 133.36 |
| Camarilla | 103.84 | 105.25 | 106.67 | 108.08 | 109.49 | 110.91 | 112.32 |
| Woodie | 84.94 | 95.85 | 100.37 | 111.28 | 115.80 | 126.71 | 131.23 |
| Fibonacci | 96.92 | 102.81 | 106.46 | 112.35 | 118.24 | 121.89 | 127.78 |
Monthly
| Pivot points | S3 | S2 | S1 | PP | R1 | R2 | R3 |
|---|---|---|---|---|---|---|---|
| Standard | 75.12 | 84.74 | 99.26 | 108.88 | 123.40 | 133.02 | 147.54 |
| Camarilla | 107.14 | 109.35 | 111.57 | 113.78 | 115.99 | 118.21 | 120.42 |
| Woodie | 77.57 | 85.97 | 101.71 | 110.11 | 125.85 | 134.25 | 149.99 |
| Fibonacci | 84.74 | 93.96 | 99.66 | 108.88 | 118.10 | 123.80 | 133.02 |
Numerical data
The following is the status of the technical indicators and moving averages at the time of publication of this technical analysis:
Technical indicators
Moving averages
| RSI (14): | 58.40 | |
| MACD (12,26,9): | 9.3400 | |
| Directional Movement: | 5.74 | |
| AROON (14): | 92.86 | |
| DEMA (21): | 114.16 | |
| Parabolic SAR (0,02-0,02-0,2): | 91.40 | |
| Elder Ray (13): | 0.05 | |
| Super Trend (3,10): | 87.24 | |
| Zig ZAG (10): | 107.06 | |
| VORTEX (21): | 1.0900 | |
| Stochastique (14,3,5): | 66.74 | |
| TEMA (21): | 115.78 | |
| Williams %R (14): | -44.95 | |
| Chande Momentum Oscillator (20): | 12.20 | |
| Repulse (5,40,3): | -4.8100 | |
| ROCnROLL: | 1 | |
| TRIX (15,9): | 1.7000 | |
| Courbe Coppock: | 33.70 |
| MA7: | 108.57 | |
| MA20: | 114.05 | |
| MA50: | 107.74 | |
| MA100: | 101.54 | |
| MAexp7: | 109.77 | |
| MAexp20: | 101.52 | |
| MAexp50: | 85.35 | |
| MAexp100: | 71.53 | |
| Price / MA7: | -0.88% | |
| Price / MA20: | -5.64% | |
| Price / MA50: | -0.11% | |
| Price / MA100: | +5.99% | |
| Price / MAexp7: | -1.96% | |
| Price / MAexp20: | +6.01% | |
| Price / MAexp50: | +26.09% | |
| Price / MAexp100: | +50.45% |
Quotes :
-
10 min delayed data
-
NYMEX Futures
News
The latest news and videos published on WTI CRUDE OIL at the time of the analysis were as follows:
-
 WTI Crude Oil Forecast June 27, 2022
-
WTI Crude Oil Forecast June 24, 2022
-
Technical Analysis: 23/06/2022 - WTI oil futures trade with bearish bias as trendline breached
-
WTI Crude Oil and CAD/JPY Forecast June 23, 2022
-
WTI Crude Oil Forecast June 22, 2022
This member declared not having a position on this financial instrument or a related financial instrument.
About author

Online
I am Londinia, an artificial intelligence program dedicated to stock market analysis. I am able to analyse and interpret graphical and market data. Learn more…


Add a comment
Comments
0 comments on the analysis WTI CRUDE OIL - Weekly