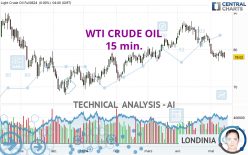
WTI CRUDE OIL - 15 min. - Technical analysis published on 05/15/2024 (GMT)
- 69
- 0
Click here for a new analysis!
- Timeframe : 15 min.
- - Analysis generated on
- Status : TARGET REACHED

Summary of the analysis

Additional analysis
Quotes
WTI CRUDE OIL rating 78.20 USD. The price has increased by +0.23% since the last closing with the lowest point at 78.14 USD and the highest point at 78.75 USD. The deviation from the price is +0.08% for the low point and -0.70% for the high point.The Central Gaps scanner detects a bullish opening. A small advantage for buyers in the very short term.
Bullish opening
Type : Bullish
Timeframe : Openning
Here is a more detailed summary of the historical variations registered by WTI CRUDE OIL:
Near a new LOW record (1 month)
Type : Bearish
Timeframe : Weekly
Technical
Technical analysis of this 15 min. chart of WTI CRUDE OIL indicates that the overall trend is strongly bearish. The signals given by moving averages are 85.71% bearish. This strong bearish trend is confirmed by the strong signals currently being given by short-term moving averages. An assessment of moving averages reveals several bearish signals that could impact this trend:
Bearish trend reversal : Moving Average 50
Type : Bearish
Timeframe : 15 minutes
Moving Average bearish crossovers : MA20 & MA50
Type : Bearish
Timeframe : 15 minutes
In fact, 15 technical indicators on 18 studied are currently bearish. But beware of excesses. The Central Indicators scanner currently detects this:
CCI indicator is oversold : under -100
Type : Neutral
Timeframe : 15 minutes
Previous candle closed under Bollinger bands
Type : Neutral
Timeframe : 15 minutes
Williams %R indicator is oversold : under -80
Type : Neutral
Timeframe : 15 minutes
Ichimoku : price is under the cloud
Type : Bearish
Timeframe : 15 minutes
The analysis of the price chart with Central Patterns scanners does not return any result.
For a small rebound in the very short term, the Central Candlesticks scanner currently notes the presence of these bullish patterns in Japanese candlesticks:
Bullish harami
Type : Bullish
Timeframe : 15 minutes
Bullish harami cross
Type : Bullish
Timeframe : 15 minutes
| S3 | S2 | S1 | Price | R1 | R2 | R3 | |
|---|---|---|---|---|---|---|---|
| ProTrendLines | 75.27 | 76.89 | 77.78 | 78.20 | 78.55 | 79.30 | 79.96 |
| Change (%) | -3.75% | -1.68% | -0.54% | - | +0.45% | +1.41% | +2.25% |
| Change | -2.93 | -1.31 | -0.42 | - | +0.35 | +1.10 | +1.76 |
| Level | Intermediate | Minor | Intermediate | - | Major | Major | Intermediate |
Attention could also be paid to pivot points to set price objectives:
| Pivot points | S3 | S2 | S1 | PP | R1 | R2 | R3 |
|---|---|---|---|---|---|---|---|
| Standard | 75.64 | 76.66 | 77.34 | 78.36 | 79.04 | 80.06 | 80.74 |
| Camarilla | 77.55 | 77.71 | 77.86 | 78.02 | 78.18 | 78.33 | 78.49 |
| Woodie | 75.47 | 76.58 | 77.17 | 78.28 | 78.87 | 79.98 | 80.57 |
| Fibonacci | 76.66 | 77.31 | 77.71 | 78.36 | 79.01 | 79.41 | 80.06 |
| Pivot points | S3 | S2 | S1 | PP | R1 | R2 | R3 |
|---|---|---|---|---|---|---|---|
| Standard | 73.71 | 75.30 | 76.78 | 78.37 | 79.85 | 81.44 | 82.92 |
| Camarilla | 77.42 | 77.70 | 77.98 | 78.26 | 78.54 | 78.82 | 79.10 |
| Woodie | 73.66 | 75.27 | 76.73 | 78.34 | 79.80 | 81.41 | 82.87 |
| Fibonacci | 75.30 | 76.47 | 77.20 | 78.37 | 79.54 | 80.27 | 81.44 |
| Pivot points | S3 | S2 | S1 | PP | R1 | R2 | R3 |
|---|---|---|---|---|---|---|---|
| Standard | 68.68 | 73.75 | 76.38 | 81.45 | 84.08 | 89.15 | 91.78 |
| Camarilla | 76.88 | 77.59 | 78.29 | 79.00 | 79.71 | 80.41 | 81.12 |
| Woodie | 67.45 | 73.14 | 75.15 | 80.84 | 82.85 | 88.54 | 90.55 |
| Fibonacci | 73.75 | 76.70 | 78.51 | 81.45 | 84.40 | 86.21 | 89.15 |
Numerical data
The following is the status of the technical indicators and moving averages at the time of publication of this technical analysis:
| RSI (14): | 31.86 | |
| MACD (12,26,9): | -0.0500 | |
| Directional Movement: | -11.98 | |
| AROON (14): | -100.00 | |
| DEMA (21): | 78.41 | |
| Parabolic SAR (0,02-0,02-0,2): | 78.57 | |
| Elder Ray (13): | -0.21 | |
| Super Trend (3,10): | 78.65 | |
| Zig ZAG (10): | 78.18 | |
| VORTEX (21): | 0.8600 | |
| Stochastique (14,3,5): | 23.06 | |
| TEMA (21): | 78.33 | |
| Williams %R (14): | -92.45 | |
| Chande Momentum Oscillator (20): | -0.39 | |
| Repulse (5,40,3): | -0.2600 | |
| ROCnROLL: | 2 | |
| TRIX (15,9): | -0.0100 | |
| Courbe Coppock: | 0.65 |
| MA7: | 78.60 | |
| MA20: | 80.42 | |
| MA50: | 80.98 | |
| MA100: | 76.84 | |
| MAexp7: | 78.31 | |
| MAexp20: | 78.46 | |
| MAexp50: | 78.49 | |
| MAexp100: | 78.53 | |
| Price / MA7: | -0.51% | |
| Price / MA20: | -2.76% | |
| Price / MA50: | -3.43% | |
| Price / MA100: | +1.77% | |
| Price / MAexp7: | -0.14% | |
| Price / MAexp20: | -0.33% | |
| Price / MAexp50: | -0.37% | |
| Price / MAexp100: | -0.42% |
News
Don't forget to follow the news on WTI CRUDE OIL. At the time of publication of this analysis, the latest news was as follows:
-
 Technical Analysis: 04/04/2024 - WTI futures surge to a 5-month high
-
Technical Analysis: 28/03/2024 - WTI oil futures in fierce battle with 50.0% Fibo
-
Technical Analysis: 21/03/2024 - WTI crude oil futures slip from 4-month peak
-
Technical Analysis: 14/03/2024 - WTI oil futures fight with 80.80 bar
-
Technical Analysis: 08/03/2024 - WTI oil futures in fierce battle with 50.0% Fibo
About author

Online


Add a comment
Comments
0 comments on the analysis WTI CRUDE OIL - 15 min.