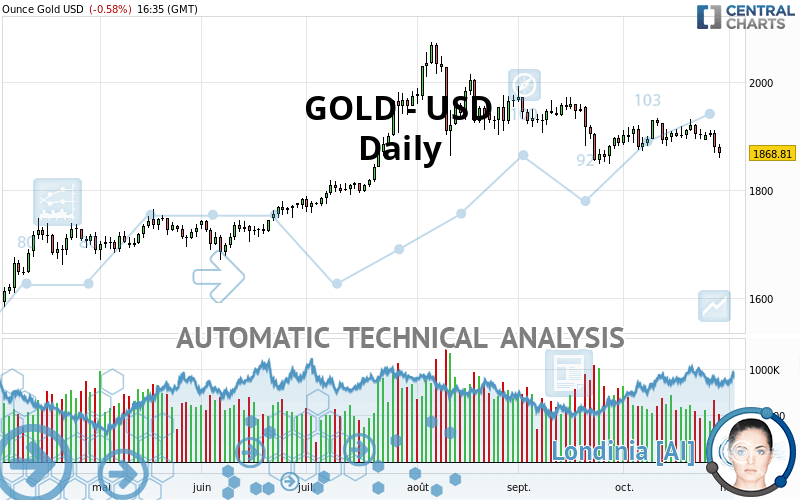
GOLD - USD - Daily - Technical analysis published on 10/29/2020 (GMT)
- Who voted?
- 157
- 0
Click here for a new analysis!
- Timeframe : Daily
- - Analysis generated on
- Status : INVALID

Summary of the analysis

Additional analysis
Quotes
The GOLD - USD rating is 1,868.82 USD. On the day, this instrument lost -0.58% with the lowest point at 1,860.02 USD and the highest point at 1,885.07 USD. The deviation from the price is +0.47% for the low point and -0.86% for the high point.A bullish opening was detected by the Central Gaps scanner. Buyers are trying to impose a bullish momentum in the very short term.
Bullish opening
Type : Bullish
Timeframe : Openning
So that you have an overall view of the price change, here is a table showing the variations over several periods:
Technical
Technical analysis of GOLD - USD in Daily shows an overall bearish trend. 67.86% of the signals given by moving averages are bearish. The overall trend is reinforced by the strong bearish signals from short-term moving averages. The Central Indicators scanner detects bearish signals on moving averages that could impact this trend:
Bearish trend reversal : Moving Average 20
Type : Bearish
Timeframe : Daily
Bearish price crossover with Moving Average 20
Type : Bearish
Timeframe : Daily
Bearish price crossover with Moving Average 100
Type : Bearish
Timeframe : Daily
In fact, 12 technical indicators on 18 studied are currently positioned bearish. Caution: the Central Indicators scanner currently detects an excess:
CCI indicator is oversold : under -100
Type : Neutral
Timeframe : Daily
Williams %R indicator is oversold : under -80
Type : Neutral
Timeframe : Daily
Pivot points : price is under support 3
Type : Neutral
Timeframe : Weekly
MACD crosses DOWN its Moving Average
Type : Bearish
Timeframe : Daily
Parabolic SAR indicator bearish reversal
Type : Bearish
Timeframe : Daily
Aroon indicator bearish trend
Type : Bearish
Timeframe : Daily
Price is back under the pivot point
Type : Bearish
Timeframe : Daily
Central Patterns, the scanner specializing in chart patterns, did not identify any signals.
Central Candlesticks, the scanner specialised in Japanese candlesticks, detects a bearish signal that could support the hypothesis of a small drop in the very short term:
Bearish engulfing lines
Type : Bearish
Timeframe : Daily
| S3 | S2 | S1 | Price | R1 | R2 | |
|---|---|---|---|---|---|---|
| ProTrendLines | 1,682.00 | 1,792.46 | 1,855.03 | 1,868.82 | 1,909.60 | 2,069.41 |
| Change (%) | -10.00% | -4.09% | -0.74% | - | +2.18% | +10.73% |
| Change | -186.82 | -76.36 | -13.79 | - | +40.78 | +200.59 |
| Level | Intermediate | Intermediate | Intermediate | - | Major | Major |
Attention could also be paid to pivot points to set price objectives:
| Pivot points | S3 | S2 | S1 | PP | R1 | R2 | R3 |
|---|---|---|---|---|---|---|---|
| Standard | 1,820.89 | 1,845.16 | 1,862.43 | 1,886.70 | 1,903.97 | 1,928.24 | 1,945.51 |
| Camarilla | 1,868.29 | 1,872.09 | 1,875.90 | 1,879.71 | 1,883.52 | 1,887.33 | 1,891.13 |
| Woodie | 1,817.40 | 1,843.41 | 1,858.94 | 1,884.95 | 1,900.48 | 1,926.49 | 1,942.02 |
| Fibonacci | 1,845.16 | 1,861.03 | 1,870.83 | 1,886.70 | 1,902.57 | 1,912.37 | 1,928.24 |
| Pivot points | S3 | S2 | S1 | PP | R1 | R2 | R3 |
|---|---|---|---|---|---|---|---|
| Standard | 1,849.68 | 1,872.03 | 1,886.77 | 1,909.12 | 1,923.86 | 1,946.21 | 1,960.95 |
| Camarilla | 1,891.30 | 1,894.70 | 1,898.10 | 1,901.50 | 1,904.90 | 1,908.30 | 1,911.70 |
| Woodie | 1,845.87 | 1,870.13 | 1,882.96 | 1,907.22 | 1,920.05 | 1,944.31 | 1,957.14 |
| Fibonacci | 1,872.03 | 1,886.20 | 1,894.96 | 1,909.12 | 1,923.29 | 1,932.05 | 1,946.21 |
| Pivot points | S3 | S2 | S1 | PP | R1 | R2 | R3 |
|---|---|---|---|---|---|---|---|
| Standard | 1,683.03 | 1,765.90 | 1,826.76 | 1,909.63 | 1,970.49 | 2,053.36 | 2,114.22 |
| Camarilla | 1,848.10 | 1,861.28 | 1,874.46 | 1,887.63 | 1,900.81 | 1,913.98 | 1,927.16 |
| Woodie | 1,672.04 | 1,760.40 | 1,815.77 | 1,904.13 | 1,959.50 | 2,047.86 | 2,103.23 |
| Fibonacci | 1,765.90 | 1,820.80 | 1,854.72 | 1,909.63 | 1,964.53 | 1,998.45 | 2,053.36 |
Numerical data
The following is the status of technical indicators and moving averages registered at the time this technical analysis was created:
| RSI (14): | 39.50 | |
| MACD (12,26,9): | -6.4400 | |
| Directional Movement: | -11.96 | |
| AROON (14): | -92.86 | |
| DEMA (21): | 1,892.22 | |
| Parabolic SAR (0,02-0,02-0,2): | 1,932.08 | |
| Elder Ray (13): | -24.58 | |
| Super Trend (3,10): | 1,948.06 | |
| Zig ZAG (10): | 1,869.66 | |
| VORTEX (21): | 0.9600 | |
| Stochastique (14,3,5): | 25.20 | |
| TEMA (21): | 1,890.30 | |
| Williams %R (14): | -86.20 | |
| Chande Momentum Oscillator (20): | -23.58 | |
| Repulse (5,40,3): | -1.5800 | |
| ROCnROLL: | 2 | |
| TRIX (15,9): | -0.0400 | |
| Courbe Coppock: | 0.74 |
| MA7: | 1,897.78 | |
| MA20: | 1,901.32 | |
| MA50: | 1,917.18 | |
| MA100: | 1,888.80 | |
| MAexp7: | 1,891.43 | |
| MAexp20: | 1,900.68 | |
| MAexp50: | 1,904.19 | |
| MAexp100: | 1,871.31 | |
| Price / MA7: | -1.53% | |
| Price / MA20: | -1.71% | |
| Price / MA50: | -2.52% | |
| Price / MA100: | -1.06% | |
| Price / MAexp7: | -1.20% | |
| Price / MAexp20: | -1.68% | |
| Price / MAexp50: | -1.86% | |
| Price / MAexp100: | -0.13% |
News
The latest news and videos published on GOLD - USD at the time of the analysis were as follows:
-
 Gold Technical Analysis for October 30, 2020 by FXEmpire
-
Direxion Daily Junior Gold Miners Index Bull 2X Shares - JNUG Stock Chart Technical Analysis for 10-
-
Direxion Daily Junior Gold Miners Index Bear 2X Shares - JDST Stock Chart Technical Analysis for 10-
-
Gold and Silver Forecast October 29, 2020
-
Gold Technical Analysis for October 29, 2020 by FXEmpire
About author

Online


Add a comment
Comments
0 comments on the analysis GOLD - USD - Daily