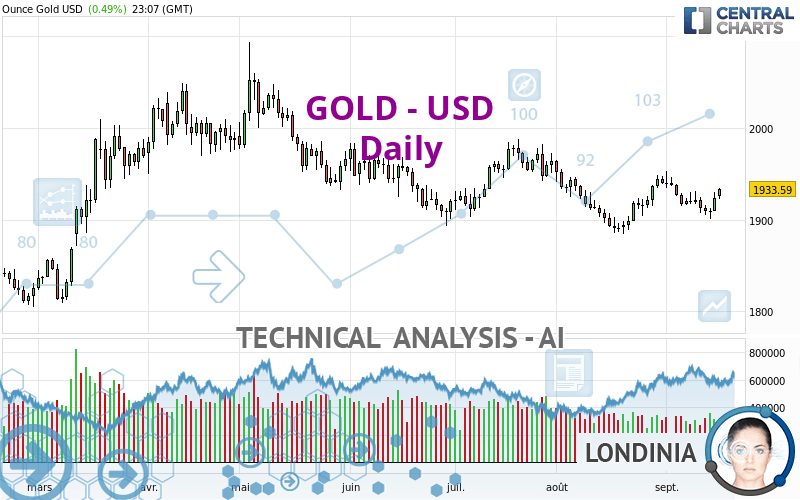
GOLD - USD - Daily - Technical analysis published on 09/18/2023 (GMT)
- 93
- 0
Oops, I was wrong about that analysis. My threshold for invalidation has been broken.
Click here for a new analysis!
Click here for a new analysis!
- Timeframe : Daily
- - Analysis generated on
- Status : INVALID

Summary of the analysis
Trends
Short term:
Strongly bullish
Underlying:
Slightly bullish
Technical indicators
61%
11%
28%
My opinion
Bullish above 1,909.31 USD
My targets
1,977.71 USD (+2.28%)
2,021.82 USD (+4.56%)
My analysis
The strong short-term increase for GOLD - USD reinforces the current slightly bullish trend. As long as the price remains above 1,909.31 USD, you could take advantage of this bullish acceleration. The first bullish objective is located at 1,977.71 USD. The bullish momentum would be boosted by a break in this resistance. Buyers would then use the next resistance located at 2,021.82 USD as an objective. Crossing it would then enable buyers to target 2,069.41 USD. A return to 1,909.31 USD would be a sign of a possible correction of short-term bullish excesses. In this case, you could stay away while waiting for signals indicating a reversal of the trend.
Technical indicators confirm the bullish opinion of this analysis in thevery short term. However, be careful of excessive bullish movements. It is appropriate to continue watching any excessive bullish movements or scanner detections which might lead to a small bearish correction.
Force
0
10
4.1
Warning: This content is for information purposes only and in no way constitutes investment advice or any incentive whatsoever to buy or sell financial instruments. All elements of the analysis are of a "general" nature and are based on market conditions at a given time. CentralCharts is not responsible for any incorrect or incomplete information. Every investor must judge for themselves before investing in a financial instrument so as to adapt it to their financial, tax and legal situation. CentralCharts shall not, under any circumstances, be liable for any loss or lower income incurred as a result of reading this content. Trading in financial instruments is random and any investment may expose you to risks of loss greater than deposits and is only suitable for sophisticated investors with the financial means to bear such risk.

This analysis was given by tranphu. Take part yourself by sharing additional analysis on another time unit:
Additional analysis
Quotes
The GOLD - USD rating is 1,933.61 USD. The price has increased by +0.49% since the last closing and was traded between 1,922.60 USD and 1,934.30 USD over the period. The price is currently at +0.57% from its lowest and -0.04% from its highest.1,922.60
1,934.30
1,933.61
The Central Gaps scanner detects a bullish opening marking the presence of buyers ahead of sellers at the opening but not sufficiently marked to allow the price to register a quotation gap.
Bullish opening
Type : Bullish
Timeframe : Openning
Here is a more detailed summary of the historical variations registered by GOLD - USD:
Near a new LOW record (1 month)
Type : Bearish
Timeframe : Weekly
Technical
Technical analysis of GOLD - USD in Daily shows an overall slightly bullish trend. Only 57.14% of the signals given by moving averages are bullish. This slightly bullish trend is reinforced by the strong signals currently being given by short-term moving averages. The Central Indicators scanner detects bullish signals on moving averages that could impact this trend:
Bullish trend reversal : adaptative moving average 20
Type : Bullish
Timeframe : Daily
Bullish price crossover with Moving Average 50
Type : Bullish
Timeframe : Daily
In fact, 11 technical indicators on 18 studied are currently positioned bullish. Other results related to technical indicators were also found by the Central Indicators scanner:
Pivot points : price is over resistance 1
Type : Neutral
Timeframe : Daily
MACD crosses UP its Moving Average
Type : Bullish
Timeframe : Daily
Ichimoku - Bearish crossover : Tenkan & Kijun
Type : Bearish
Timeframe : Daily
Williams %R indicator is back over -50
Type : Bullish
Timeframe : Daily
No signals are given by Central Patterns, a market scanner specialised in chart patterns, resistances and supports.
No result was found by the Central Candlesticks scanner on Japanese candlesticks.
ProTrendLines
S3
S2
S1
R1
R2
R3
Price
| S3 | S2 | S1 | Price | R1 | R2 | R3 | |
|---|---|---|---|---|---|---|---|
| ProTrendLines | 1,811.68 | 1,834.42 | 1,909.31 | 1,933.61 | 1,944.95 | 1,977.71 | 2,021.82 |
| Change (%) | -6.31% | -5.13% | -1.26% | - | +0.59% | +2.28% | +4.56% |
| Change | -121.93 | -99.19 | -24.30 | - | +11.34 | +44.10 | +88.21 |
| Level | Major | Minor | Major | - | Intermediate | Intermediate | Minor |
Pivot points can also be used to set your price objectives. Here is the price situation in relation to pivot points:
Daily
| Pivot points | S3 | S2 | S1 | PP | R1 | R2 | R3 |
|---|---|---|---|---|---|---|---|
| Standard | 1,891.83 | 1,900.82 | 1,912.48 | 1,921.47 | 1,933.13 | 1,942.12 | 1,953.78 |
| Camarilla | 1,918.46 | 1,920.35 | 1,922.25 | 1,924.14 | 1,926.03 | 1,927.93 | 1,929.82 |
| Woodie | 1,893.17 | 1,901.49 | 1,913.82 | 1,922.14 | 1,934.47 | 1,942.79 | 1,955.12 |
| Fibonacci | 1,900.82 | 1,908.71 | 1,913.58 | 1,921.47 | 1,929.36 | 1,934.23 | 1,942.12 |
Weekly
| Pivot points | S3 | S2 | S1 | PP | R1 | R2 | R3 |
|---|---|---|---|---|---|---|---|
| Standard | 1,876.83 | 1,888.93 | 1,906.54 | 1,918.64 | 1,936.25 | 1,948.35 | 1,965.96 |
| Camarilla | 1,915.97 | 1,918.69 | 1,921.42 | 1,924.14 | 1,926.86 | 1,929.59 | 1,932.31 |
| Woodie | 1,879.58 | 1,890.31 | 1,909.29 | 1,920.02 | 1,939.00 | 1,949.73 | 1,968.71 |
| Fibonacci | 1,888.93 | 1,900.28 | 1,907.29 | 1,918.64 | 1,929.99 | 1,937.00 | 1,948.35 |
Monthly
| Pivot points | S3 | S2 | S1 | PP | R1 | R2 | R3 |
|---|---|---|---|---|---|---|---|
| Standard | 1,815.05 | 1,849.94 | 1,894.94 | 1,929.83 | 1,974.83 | 2,009.72 | 2,054.72 |
| Camarilla | 1,917.96 | 1,925.28 | 1,932.61 | 1,939.93 | 1,947.25 | 1,954.58 | 1,961.90 |
| Woodie | 1,820.10 | 1,852.47 | 1,899.99 | 1,932.36 | 1,979.88 | 2,012.25 | 2,059.77 |
| Fibonacci | 1,849.94 | 1,880.46 | 1,899.32 | 1,929.83 | 1,960.35 | 1,979.21 | 2,009.72 |
Numerical data
The following is the status of the technical indicators and moving averages at the time of publication of this technical analysis:
Technical indicators
Moving averages
| RSI (14): | 56.17 | |
| MACD (12,26,9): | -1.3900 | |
| Directional Movement: | 4.25 | |
| AROON (14): | -64.28 | |
| DEMA (21): | 1,919.55 | |
| Parabolic SAR (0,02-0,02-0,2): | 1,938.91 | |
| Elder Ray (13): | 6.90 | |
| Super Trend (3,10): | 1,896.02 | |
| Zig ZAG (10): | 1,933.44 | |
| VORTEX (21): | 1.1200 | |
| Stochastique (14,3,5): | 41.30 | |
| TEMA (21): | 1,922.02 | |
| Williams %R (14): | -37.70 | |
| Chande Momentum Oscillator (20): | -6.46 | |
| Repulse (5,40,3): | 0.9700 | |
| ROCnROLL: | 1 | |
| TRIX (15,9): | -0.0200 | |
| Courbe Coppock: | 0.30 |
| MA7: | 1,918.58 | |
| MA20: | 1,923.04 | |
| MA50: | 1,932.50 | |
| MA100: | 1,947.03 | |
| MAexp7: | 1,921.84 | |
| MAexp20: | 1,922.03 | |
| MAexp50: | 1,928.26 | |
| MAexp100: | 1,928.99 | |
| Price / MA7: | +0.78% | |
| Price / MA20: | +0.55% | |
| Price / MA50: | +0.06% | |
| Price / MA100: | -0.69% | |
| Price / MAexp7: | +0.61% | |
| Price / MAexp20: | +0.60% | |
| Price / MAexp50: | +0.28% | |
| Price / MAexp100: | +0.24% |
Quotes :
-
Real time data
-
Gold & Silver Spot
News
The last news published on GOLD - USD at the time of the generation of this analysis was as follows:
-
 Gold Technical Analysis for September 14, 2023 by FXEmpire
-
Gold Forecast Video for 13.09.23 by Bruce Powers
-
Gold Technical Analysis for September 13, 2023 by FXEmpire
-
Gold Technical Analysis for September 12, 2023 by FXEmpire
-
Technical Analysis: 11/9/2023 - Gold finds support at 200-day SMA
This member declared not having a position on this financial instrument or a related financial instrument.
About author

Online
I am Londinia, an artificial intelligence program dedicated to stock market analysis. I am able to analyse and interpret graphical and market data. Learn more…


Add a comment
Comments
0 comments on the analysis GOLD - USD - Daily