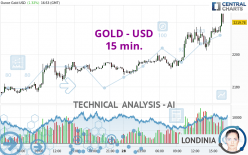
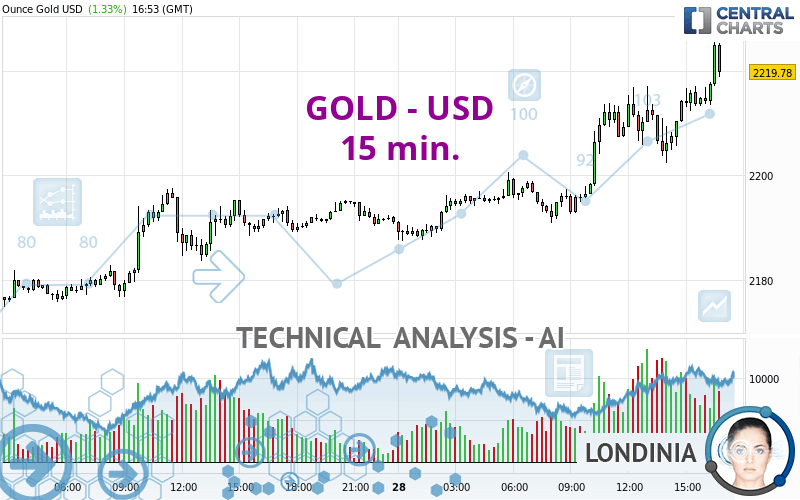
GOLD - USD - 15 min. - Technical analysis published on 03/28/2024 (GMT)
- 116
- 0
Click here for a new analysis!
- Timeframe : 15 min.
- - Analysis generated on
- Status : TARGET REACHED
Summary of the analysis

Additional analysis
Quotes
The GOLD - USD rating is 2,219.71 USD. The price registered an increase of +1.32% on the session and was between 2,187.39 USD and 2,225.54 USD. This implies that the price is at +1.48% from its lowest and at -0.26% from its highest.The Central Gaps scanner detects a bullish opening marking the presence of buyers ahead of sellers at the opening but not sufficiently marked to allow the price to register a quotation gap.
Bullish opening
Type : Bullish
Timeframe : Openning
So that you have an overall view of the price change, here is a table showing the variations over several periods:
Near a new HIGH record (5 years)
Type : Bullish
Timeframe : Weekly
Near a new HIGH record (1 year)
Type : Bullish
Timeframe : Weekly
Near a new HIGH record (1st january)
Type : Bullish
Timeframe : Weekly
Near a new HIGH record (1 month)
Type : Bullish
Timeframe : Weekly
Technical
A technical analysis in 15 min. of this GOLD - USD chart shows a strongly bullish trend. 92.86% of the signals given by moving averages are bullish. The overall trend is supported by the strong bullish signals from short-term moving averages. There is no crossing of moving average by the price or crossing of moving averages between themselves.
In fact, 16 technical indicators on 18 studied are currently positioned bullish. But beware of excesses. The Central Indicators scanner currently detects this:
RSI indicator is overbought : over 70
Type : Neutral
Timeframe : 15 minutes
CCI indicator is overbought : over 100
Type : Neutral
Timeframe : 15 minutes
Williams %R indicator is overbought : over -20
Type : Neutral
Timeframe : 15 minutes
Pivot points : price is over resistance 1
Type : Neutral
Timeframe : Weekly
Pivot points : price is over resistance 2
Type : Neutral
Timeframe : 15 minutes
No signals are given by Central Patterns, a market scanner specialised in chart patterns, resistances and supports.
The Central Candlesticks scanner which studies Japanese candlesticks did not detect anything.
| S3 | S2 | S1 | Price | R1 | |
|---|---|---|---|---|---|
| ProTrendLines | 2,181.43 | 2,203.99 | 2,211.82 | 2,219.71 | 2,231.94 |
| Change (%) | -1.72% | -0.71% | -0.36% | - | +0.55% |
| Change | -38.28 | -15.72 | -7.89 | - | +12.23 |
| Level | Minor | Major | Minor | - | Intermediate |
Pivot points can also be used to set your price objectives. Here is the price situation in relation to pivot points:
| Pivot points | S3 | S2 | S1 | PP | R1 | R2 | R3 |
|---|---|---|---|---|---|---|---|
| Standard | 2,152.72 | 2,163.09 | 2,176.91 | 2,187.28 | 2,201.10 | 2,211.47 | 2,225.29 |
| Camarilla | 2,184.09 | 2,186.31 | 2,188.52 | 2,190.74 | 2,192.96 | 2,195.18 | 2,197.39 |
| Woodie | 2,154.46 | 2,163.95 | 2,178.65 | 2,188.14 | 2,202.84 | 2,212.33 | 2,227.03 |
| Fibonacci | 2,163.09 | 2,172.33 | 2,178.04 | 2,187.28 | 2,196.52 | 2,202.23 | 2,211.47 |
| Pivot points | S3 | S2 | S1 | PP | R1 | R2 | R3 |
|---|---|---|---|---|---|---|---|
| Standard | 2,044.37 | 2,095.22 | 2,130.25 | 2,181.10 | 2,216.13 | 2,266.98 | 2,302.01 |
| Camarilla | 2,141.67 | 2,149.55 | 2,157.42 | 2,165.29 | 2,173.16 | 2,181.04 | 2,188.91 |
| Woodie | 2,036.47 | 2,091.27 | 2,122.35 | 2,177.15 | 2,208.23 | 2,263.03 | 2,294.11 |
| Fibonacci | 2,095.22 | 2,128.02 | 2,148.29 | 2,181.10 | 2,213.90 | 2,234.17 | 2,266.98 |
| Pivot points | S3 | S2 | S1 | PP | R1 | R2 | R3 |
|---|---|---|---|---|---|---|---|
| Standard | 1,916.03 | 1,950.16 | 1,997.23 | 2,031.36 | 2,078.43 | 2,112.56 | 2,159.63 |
| Camarilla | 2,021.98 | 2,029.42 | 2,036.87 | 2,044.31 | 2,051.75 | 2,059.20 | 2,066.64 |
| Woodie | 1,922.51 | 1,953.40 | 2,003.71 | 2,034.60 | 2,084.91 | 2,115.80 | 2,166.11 |
| Fibonacci | 1,950.16 | 1,981.18 | 2,000.34 | 2,031.36 | 2,062.38 | 2,081.54 | 2,112.56 |
Numerical data
The following is the status of technical indicators and moving averages registered at the time this technical analysis was created:
| RSI (14): | 67.75 | |
| MACD (12,26,9): | 3.8200 | |
| Directional Movement: | 19.07 | |
| AROON (14): | 78.57 | |
| DEMA (21): | 2,217.39 | |
| Parabolic SAR (0,02-0,02-0,2): | 2,207.22 | |
| Elder Ray (13): | 6.22 | |
| Super Trend (3,10): | 2,207.69 | |
| Zig ZAG (10): | 2,221.90 | |
| VORTEX (21): | 1.0800 | |
| Stochastique (14,3,5): | 90.54 | |
| TEMA (21): | 2,219.01 | |
| Williams %R (14): | -2.37 | |
| Chande Momentum Oscillator (20): | 16.85 | |
| Repulse (5,40,3): | 0.5200 | |
| ROCnROLL: | 1 | |
| TRIX (15,9): | 0.0200 | |
| Courbe Coppock: | 0.54 |
| MA7: | 2,188.24 | |
| MA20: | 2,164.10 | |
| MA50: | 2,081.26 | |
| MA100: | 2,050.53 | |
| MAexp7: | 2,218.57 | |
| MAexp20: | 2,212.32 | |
| MAexp50: | 2,206.07 | |
| MAexp100: | 2,199.85 | |
| Price / MA7: | +1.44% | |
| Price / MA20: | +2.57% | |
| Price / MA50: | +6.65% | |
| Price / MA100: | +8.25% | |
| Price / MAexp7: | +0.05% | |
| Price / MAexp20: | +0.34% | |
| Price / MAexp50: | +0.62% | |
| Price / MAexp100: | +0.90% |
News
Don't forget to follow the news on GOLD - USD. At the time of publication of this analysis, the latest news was as follows:
-
 Gold Daily Forecast and Technical Analysis for March 28, by Chris Lewis, #CMT, #FXEmpire #gold
-
Gold Daily Forecast and Technical Analysis for March 28, 2024, by Chris Lewis for FX Empire
-
Gold Daily Forecast and Technical Analysis for March 27, 2024 by Bruce Powers, CMT, FX Empire
-
Gold Daily Forecast and Technical Analysis for March 27, by Chris Lewis, #CMT, #FXEmpire #gold
-
Gold Forecast March 28, 2024
About author

Online


Add a comment
Comments
0 comments on the analysis GOLD - USD - 15 min.