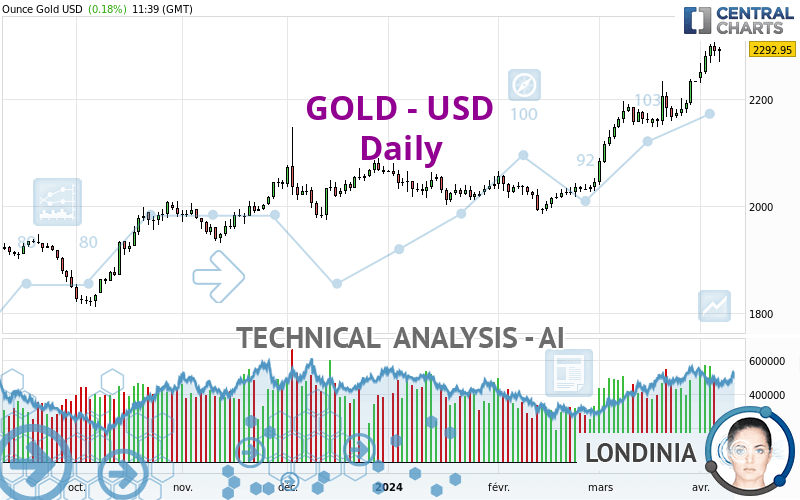
GOLD - USD - Daily - Technical analysis published on 04/05/2024 (GMT)
- 94
- 0
Click here for a new analysis!
- Timeframe : Daily
- - Analysis generated on
- Status : TARGET REACHED

Summary of the analysis

Additional analysis
Quotes
The GOLD - USD rating is 2,292.93 USD. The price has increased by +0.18% since the last closing and was between 2,267.82 USD and 2,296.17 USD. This implies that the price is at +1.11% from its lowest and at -0.14% from its highest.The Central Gaps scanner detects a bullish opening marking the presence of buyers ahead of sellers at the opening but not sufficiently marked to allow the price to register a quotation gap.
Bullish opening
Type : Bullish
Timeframe : Openning
A study of price movements over other periods shows the following variations:
New HIGH record (5 years)
Type : Bullish
Timeframe : Weekly
Near a new HIGH record (1 year)
Type : Bullish
Timeframe : Weekly
Near a new HIGH record (1st january)
Type : Bullish
Timeframe : Weekly
Near a new HIGH record (1 month)
Type : Bullish
Timeframe : Weekly
Technical
Technical analysis of this Daily chart of GOLD - USD indicates that the overall trend is strongly bullish. The signals given by the moving averages are 92.86% bullish. This strong bullish trend is confirmed by the strong signals currently being given by short-term moving averages. There is no crossing of moving average by the price or crossing of moving averages between themselves.
Technical indicators are strongly bullish, suggesting that the price increase should continue.
Caution: the Central Indicators scanner currently detects an excess:
RSI indicator is overbought : over 70
Type : Neutral
Timeframe : Daily
CCI indicator is overbought : over 100
Type : Neutral
Timeframe : Daily
Williams %R indicator is overbought : over -20
Type : Neutral
Timeframe : Daily
Pivot points : price is over resistance 2
Type : Neutral
Timeframe : Weekly
Price is back over the pivot point
Type : Bullish
Timeframe : Daily
The analysis of the price chart with Central Patterns scanners does not return any result.
Central Candlesticks, the scanner specialised in Japanese candlesticks, detects a bullish signal that could support the hypothesis of a small rebound in the very short term:
Bullish harami
Type : Bullish
Timeframe : Daily
| S3 | S2 | S1 | Price | |
|---|---|---|---|---|
| ProTrendLines | 2,049.28 | 2,079.55 | 2,203.99 | 2,292.93 |
| Change (%) | -10.63% | -9.31% | -3.88% | - |
| Change | -243.65 | -213.38 | -88.94 | - |
| Level | Major | Minor | Major | - |
Attention could also be paid to pivot points to set price objectives:
| Pivot points | S3 | S2 | S1 | PP | R1 | R2 | R3 |
|---|---|---|---|---|---|---|---|
| Standard | 2,246.77 | 2,257.30 | 2,275.12 | 2,285.65 | 2,303.47 | 2,314.00 | 2,331.82 |
| Camarilla | 2,285.15 | 2,287.75 | 2,290.35 | 2,292.95 | 2,295.55 | 2,298.15 | 2,300.75 |
| Woodie | 2,250.43 | 2,259.12 | 2,278.78 | 2,287.47 | 2,307.13 | 2,315.82 | 2,335.48 |
| Fibonacci | 2,257.30 | 2,268.13 | 2,274.82 | 2,285.65 | 2,296.48 | 2,303.17 | 2,314.00 |
| Pivot points | S3 | S2 | S1 | PP | R1 | R2 | R3 |
|---|---|---|---|---|---|---|---|
| Standard | 2,168.66 | 2,198.59 | 2,245.77 | 2,275.70 | 2,322.88 | 2,352.81 | 2,399.99 |
| Camarilla | 2,271.75 | 2,278.81 | 2,285.88 | 2,292.95 | 2,300.02 | 2,307.09 | 2,314.16 |
| Woodie | 2,177.29 | 2,202.90 | 2,254.40 | 2,280.01 | 2,331.51 | 2,357.12 | 2,408.62 |
| Fibonacci | 2,198.59 | 2,228.05 | 2,246.24 | 2,275.70 | 2,305.16 | 2,323.35 | 2,352.81 |
| Pivot points | S3 | S2 | S1 | PP | R1 | R2 | R3 |
|---|---|---|---|---|---|---|---|
| Standard | 1,905.68 | 1,972.37 | 2,103.03 | 2,169.72 | 2,300.38 | 2,367.07 | 2,497.73 |
| Camarilla | 2,179.41 | 2,197.50 | 2,215.59 | 2,233.68 | 2,251.77 | 2,269.86 | 2,287.95 |
| Woodie | 1,937.66 | 1,988.36 | 2,135.01 | 2,185.71 | 2,332.36 | 2,383.06 | 2,529.71 |
| Fibonacci | 1,972.37 | 2,047.76 | 2,094.34 | 2,169.72 | 2,245.11 | 2,291.69 | 2,367.07 |
Numerical data
The following is the status of technical indicators and moving averages registered at the time this technical analysis was created:
| RSI (14): | 77.17 | |
| MACD (12,26,9): | 50.7700 | |
| Directional Movement: | 29.73 | |
| AROON (14): | 85.72 | |
| DEMA (21): | 2,270.76 | |
| Parabolic SAR (0,02-0,02-0,2): | 2,242.43 | |
| Elder Ray (13): | 47.97 | |
| Super Trend (3,10): | 2,195.87 | |
| Zig ZAG (10): | 2,293.17 | |
| VORTEX (21): | 1.2200 | |
| Stochastique (14,3,5): | 92.76 | |
| TEMA (21): | 2,291.54 | |
| Williams %R (14): | -7.85 | |
| Chande Momentum Oscillator (20): | 136.08 | |
| Repulse (5,40,3): | 1.9800 | |
| ROCnROLL: | 1 | |
| TRIX (15,9): | 0.3000 | |
| Courbe Coppock: | 8.64 |
| MA7: | 2,261.93 | |
| MA20: | 2,203.48 | |
| MA50: | 2,107.39 | |
| MA100: | 2,067.18 | |
| MAexp7: | 2,264.14 | |
| MAexp20: | 2,206.82 | |
| MAexp50: | 2,136.61 | |
| MAexp100: | 2,082.08 | |
| Price / MA7: | +1.37% | |
| Price / MA20: | +4.06% | |
| Price / MA50: | +8.80% | |
| Price / MA100: | +10.92% | |
| Price / MAexp7: | +1.27% | |
| Price / MAexp20: | +3.90% | |
| Price / MAexp50: | +7.32% | |
| Price / MAexp100: | +10.13% |
News
Don't forget to follow the news on GOLD - USD. At the time of publication of this analysis, the latest news was as follows:
-
 Gold Daily Forecast and Technical Analysis for April 04, 2024 by Bruce Powers, CMT, FX Empire
-
Gold Daily Forecast and Technical Analysis for April 4, by Chris Lewis, #XAUUSD, #FXEmpire #gold
-
Fed Rate Cut Delay: Impact on Stocks, Bonds & Gold
-
Gold Daily Forecast and Technical Analysis for April 04, 2024, by Chris Lewis for FX Empire
-
Gold Daily Forecast and Technical Analysis for April 03, 2024 by Bruce Powers, CMT, FX Empire
About author

Online


Add a comment
Comments
0 comments on the analysis GOLD - USD - Daily