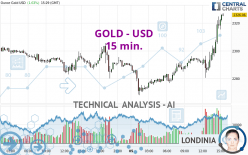
GOLD - USD - 15 min. - Technical analysis published on 04/05/2024 (GMT)
- 106
- 0
Click here for a new analysis!
- Timeframe : 15 min.
- - Analysis generated on
- Status : LEVEL MAINTAINED
Summary of the analysis

Additional analysis
Quotes
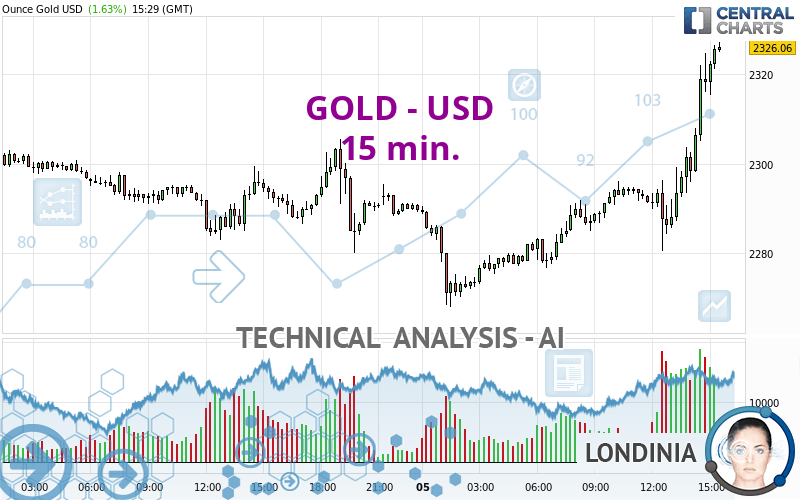
The GOLD - USD rating is 2,325.95 USD. The price registered an increase of +1.63% on the session and was traded between 2,267.82 USD and 2,327.29 USD over the period. The price is currently at +2.56% from its lowest and -0.06% from its highest.A bullish opening was detected by the Central Gaps scanner. Buyers are trying to impose a bullish momentum in the very short term.
Bullish opening
Type : Bullish
Timeframe : Openning
Here is a more detailed summary of the historical variations registered by GOLD - USD:
New HIGH record (5 years)
Type : Bullish
Timeframe : Weekly
New HIGH record (1 year)
Type : Bullish
Timeframe : Weekly
New HIGH record (1st january)
Type : Bullish
Timeframe : Weekly
New HIGH record (1 month)
Type : Bullish
Timeframe : Weekly
Technical
A technical analysis in 15 min. of this GOLD - USD chart shows a strongly bullish trend. The signals given by the moving averages are 92.86% bullish. This strong bullish trend is confirmed by the strong signals currently being given by short-term moving averages. The Central Indicators market scanner is currently detecting a bullish signal that could impact this trend:
Moving Average bullish crossovers : MA50 & MA100
Type : Bullish
Timeframe : 15 minutes
An assessment of technical indicators shows a strong bullish signal.
But beware of excesses. The Central Indicators scanner currently detects this:
RSI indicator is overbought : over 70
Type : Neutral
Timeframe : 15 minutes
CCI indicator is overbought : over 100
Type : Neutral
Timeframe : 15 minutes
Williams %R indicator is overbought : over -20
Type : Neutral
Timeframe : 15 minutes
Pivot points : price is over resistance 2
Type : Neutral
Timeframe : 15 minutes
Pivot points : price is over resistance 2
Type : Neutral
Timeframe : Weekly
No signals are given by Central Patterns, a market scanner specialised in chart patterns, resistances and supports.
Central Candlesticks, the scanner specialised in Japanese candlesticks, detects a bullish signal that could support the hypothesis of a small rebound in the very short term:
Bullish harami
Type : Bullish
Timeframe : 15 minutes
| S3 | S2 | S1 | Price | |
|---|---|---|---|---|
| ProTrendLines | 2,228.52 | 2,265.90 | 2,305.10 | 2,325.95 |
| Change (%) | -4.19% | -2.58% | -0.90% | - |
| Change | -97.43 | -60.05 | -20.85 | - |
| Level | Minor | Major | Intermediate | - |
Attention could also be paid to pivot points to set price objectives:
| Pivot points | S3 | S2 | S1 | PP | R1 | R2 | R3 |
|---|---|---|---|---|---|---|---|
| Standard | 2,227.25 | 2,247.53 | 2,286.72 | 2,307.00 | 2,346.19 | 2,366.47 | 2,405.66 |
| Camarilla | 2,309.55 | 2,315.00 | 2,320.45 | 2,325.90 | 2,331.35 | 2,336.80 | 2,342.25 |
| Woodie | 2,236.70 | 2,252.26 | 2,296.17 | 2,311.73 | 2,355.64 | 2,371.20 | 2,415.11 |
| Fibonacci | 2,247.53 | 2,270.25 | 2,284.29 | 2,307.00 | 2,329.72 | 2,343.76 | 2,366.47 |
| Pivot points | S3 | S2 | S1 | PP | R1 | R2 | R3 |
|---|---|---|---|---|---|---|---|
| Standard | 2,161.75 | 2,195.13 | 2,260.52 | 2,293.90 | 2,359.29 | 2,392.67 | 2,458.06 |
| Camarilla | 2,298.74 | 2,307.79 | 2,316.85 | 2,325.90 | 2,334.95 | 2,344.01 | 2,353.06 |
| Woodie | 2,177.75 | 2,203.13 | 2,276.52 | 2,301.90 | 2,375.29 | 2,400.67 | 2,474.06 |
| Fibonacci | 2,195.13 | 2,232.86 | 2,256.17 | 2,293.90 | 2,331.63 | 2,354.94 | 2,392.67 |
| Pivot points | S3 | S2 | S1 | PP | R1 | R2 | R3 |
|---|---|---|---|---|---|---|---|
| Standard | 1,905.68 | 1,972.37 | 2,103.03 | 2,169.72 | 2,300.38 | 2,367.07 | 2,497.73 |
| Camarilla | 2,179.41 | 2,197.50 | 2,215.59 | 2,233.68 | 2,251.77 | 2,269.86 | 2,287.95 |
| Woodie | 1,937.66 | 1,988.36 | 2,135.01 | 2,185.71 | 2,332.36 | 2,383.06 | 2,529.71 |
| Fibonacci | 1,972.37 | 2,047.76 | 2,094.34 | 2,169.72 | 2,245.11 | 2,291.69 | 2,367.07 |
Numerical data
The following is the status of technical indicators and moving averages registered at the time this technical analysis was created:
| RSI (14): | 70.42 | |
| MACD (12,26,9): | 7.2200 | |
| Directional Movement: | 26.20 | |
| AROON (14): | 64.29 | |
| DEMA (21): | 2,310.10 | |
| Parabolic SAR (0,02-0,02-0,2): | 2,293.70 | |
| Elder Ray (13): | 13.27 | |
| Super Trend (3,10): | 2,298.11 | |
| Zig ZAG (10): | 2,321.44 | |
| VORTEX (21): | 1.1800 | |
| Stochastique (14,3,5): | 91.18 | |
| TEMA (21): | 2,315.35 | |
| Williams %R (14): | -4.17 | |
| Chande Momentum Oscillator (20): | 30.80 | |
| Repulse (5,40,3): | 0.6500 | |
| ROCnROLL: | 1 | |
| TRIX (15,9): | 0.0300 | |
| Courbe Coppock: | 1.57 |
| MA7: | 2,266.42 | |
| MA20: | 2,205.03 | |
| MA50: | 2,108.01 | |
| MA100: | 2,067.50 | |
| MAexp7: | 2,315.53 | |
| MAexp20: | 2,301.16 | |
| MAexp50: | 2,293.59 | |
| MAexp100: | 2,290.74 | |
| Price / MA7: | +2.63% | |
| Price / MA20: | +5.48% | |
| Price / MA50: | +10.34% | |
| Price / MA100: | +12.50% | |
| Price / MAexp7: | +0.45% | |
| Price / MAexp20: | +1.08% | |
| Price / MAexp50: | +1.41% | |
| Price / MAexp100: | +1.53% |
News
The last news published on GOLD - USD at the time of the generation of this analysis was as follows:
-
 Gold Daily Forecast and Technical Analysis for April 04, 2024 by Bruce Powers, CMT, FX Empire
-
Gold Daily Forecast and Technical Analysis for April 4, by Chris Lewis, #XAUUSD, #FXEmpire #gold
-
Fed Rate Cut Delay: Impact on Stocks, Bonds & Gold
-
Gold Daily Forecast and Technical Analysis for April 04, 2024, by Chris Lewis for FX Empire
-
Gold Daily Forecast and Technical Analysis for April 03, 2024 by Bruce Powers, CMT, FX Empire
About author

Online


Add a comment
Comments
0 comments on the analysis GOLD - USD - 15 min.