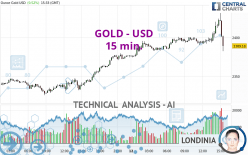
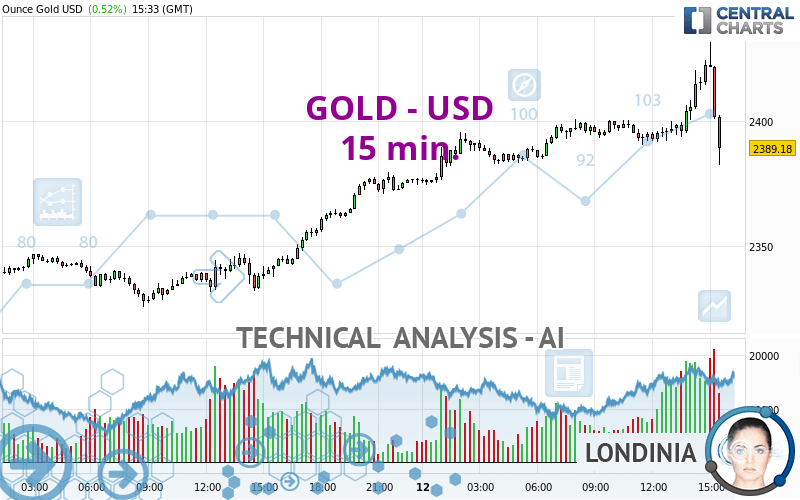
GOLD - USD - 15 min. - Technical analysis published on 04/12/2024 (GMT)
- 114
- 0
Click here for a new analysis!
- Timeframe : 15 min.
- - Analysis generated on
- Status : INVALID
Summary of the analysis

Additional analysis
Quotes
The GOLD - USD rating is 2,388.92 USD. On the day, this instrument gained +0.51% with the lowest point at 2,374.63 USD and the highest point at 2,431.55 USD. The deviation from the price is +0.60% for the low point and -1.75% for the high point.The Central Gaps scanner detects a bullish opening marking the presence of buyers ahead of sellers at the opening but not sufficiently marked to allow the price to register a quotation gap.
Bullish opening
Type : Bullish
Timeframe : Openning
Here is a more detailed summary of the historical variations registered by GOLD - USD:
New HIGH record (5 years)
Type : Bullish
Timeframe : Weekly
New HIGH record (1 year)
Type : Bullish
Timeframe : Weekly
New HIGH record (1st january)
Type : Bullish
Timeframe : Weekly
New HIGH record (1 month)
Type : Bullish
Timeframe : Weekly
Technical
A technical analysis in 15 min. of this GOLD - USD chart shows a bullish trend. 71.43% of the signals given by moving averages are bullish. Caution: the current slightly bearish signals from short-term moving averages indicate that the overall trend may be slowing down. The Central Indicators market scanner currently does not detect any result that concerns moving averages.
Technical indicators are strongly bullish, suggesting that the price increase should continue.
Caution: the Central Indicators scanner currently detects an excess:
Previous candle closed over Bollinger bands
Type : Neutral
Timeframe : 15 minutes
CCI indicator: bearish divergence
Type : Bearish
Timeframe : 15 minutes
Pivot points : price is over resistance 1
Type : Neutral
Timeframe : 15 minutes
Pivot points : price is over resistance 2
Type : Neutral
Timeframe : Weekly
Central Patterns, the scanner specializing in chart patterns, did not identify any signals.
The presence of these Japanese chandelier patterns detected by Central Candlesticks that could impact the current short-term trend were also noted:
Long black line
Type : Bearish
Timeframe : 15 minutes
Three white soldiers
Type : Bullish
Timeframe : 15 minutes
| S3 | S2 | S1 | Price | |
|---|---|---|---|---|
| ProTrendLines | 2,288.35 | 2,319.21 | 2,347.13 | 2,388.92 |
| Change (%) | -4.21% | -2.92% | -1.75% | - |
| Change | -100.57 | -69.71 | -41.79 | - |
| Level | Minor | Intermediate | Intermediate | - |
Pivot points can also be used to set your price objectives. Here is the price situation in relation to pivot points:
| Pivot points | S3 | S2 | S1 | PP | R1 | R2 | R3 |
|---|---|---|---|---|---|---|---|
| Standard | 2,288.16 | 2,307.00 | 2,341.93 | 2,360.77 | 2,395.70 | 2,414.54 | 2,449.47 |
| Camarilla | 2,362.08 | 2,367.01 | 2,371.94 | 2,376.87 | 2,381.80 | 2,386.73 | 2,391.66 |
| Woodie | 2,296.22 | 2,311.02 | 2,349.99 | 2,364.79 | 2,403.76 | 2,418.56 | 2,457.53 |
| Fibonacci | 2,307.00 | 2,327.54 | 2,340.23 | 2,360.77 | 2,381.31 | 2,394.00 | 2,414.54 |
| Pivot points | S3 | S2 | S1 | PP | R1 | R2 | R3 |
|---|---|---|---|---|---|---|---|
| Standard | 2,156.81 | 2,192.67 | 2,258.76 | 2,294.62 | 2,360.71 | 2,396.57 | 2,462.66 |
| Camarilla | 2,296.82 | 2,306.17 | 2,315.52 | 2,324.86 | 2,334.21 | 2,343.55 | 2,352.90 |
| Woodie | 2,171.94 | 2,200.23 | 2,273.89 | 2,302.18 | 2,375.84 | 2,404.13 | 2,477.79 |
| Fibonacci | 2,192.67 | 2,231.61 | 2,255.67 | 2,294.62 | 2,333.56 | 2,357.62 | 2,396.57 |
| Pivot points | S3 | S2 | S1 | PP | R1 | R2 | R3 |
|---|---|---|---|---|---|---|---|
| Standard | 1,905.68 | 1,972.37 | 2,103.03 | 2,169.72 | 2,300.38 | 2,367.07 | 2,497.73 |
| Camarilla | 2,179.41 | 2,197.50 | 2,215.59 | 2,233.68 | 2,251.77 | 2,269.86 | 2,287.95 |
| Woodie | 1,937.66 | 1,988.36 | 2,135.01 | 2,185.71 | 2,332.36 | 2,383.06 | 2,529.71 |
| Fibonacci | 1,972.37 | 2,047.76 | 2,094.34 | 2,169.72 | 2,245.11 | 2,291.69 | 2,367.07 |
Numerical data
The following are the details of the technical indicators and moving averages that were collected to generate this technical analysis:
| RSI (14): | 84.69 | |
| MACD (12,26,9): | 7.3800 | |
| Directional Movement: | 32.50 | |
| AROON (14): | 100.00 | |
| DEMA (21): | 2,414.57 | |
| Parabolic SAR (0,02-0,02-0,2): | 2,402.70 | |
| Elder Ray (13): | 17.85 | |
| Super Trend (3,10): | 2,406.54 | |
| Zig ZAG (10): | 2,423.97 | |
| VORTEX (21): | 1.2300 | |
| Stochastique (14,3,5): | 85.82 | |
| TEMA (21): | 2,417.26 | |
| Williams %R (14): | -26.35 | |
| Chande Momentum Oscillator (20): | 27.58 | |
| Repulse (5,40,3): | 0.1300 | |
| ROCnROLL: | 1 | |
| TRIX (15,9): | 0.0200 | |
| Courbe Coppock: | 1.39 |
| MA7: | 2,346.02 | |
| MA20: | 2,253.08 | |
| MA50: | 2,140.71 | |
| MA100: | 2,086.60 | |
| MAexp7: | 2,412.18 | |
| MAexp20: | 2,406.11 | |
| MAexp50: | 2,396.09 | |
| MAexp100: | 2,383.60 | |
| Price / MA7: | +1.83% | |
| Price / MA20: | +6.03% | |
| Price / MA50: | +11.59% | |
| Price / MA100: | +14.49% | |
| Price / MAexp7: | -0.96% | |
| Price / MAexp20: | -0.71% | |
| Price / MAexp50: | -0.29% | |
| Price / MAexp100: | +0.23% |
News
The last news published on GOLD - USD at the time of the generation of this analysis was as follows:
-
 Gold Long Term Forecast and Technical Analysis for April 12, 2024, by Chris Lewis for FX Empire
-
Gold Daily Forecast and Technical Analysis for April 12, 2024, by Chris Lewis for FX Empire
-
US Dollar, Gold on the Move Ahead of a UK Data-Focused Week
-
Fun Fact Friday: Enough #gold to coat the Earth?
-
Gold Daily Forecast and Technical Analysis for April 11, 2024 by Bruce Powers, CMT, FX Empire
About author

Online


Add a comment
Comments
0 comments on the analysis GOLD - USD - 15 min.