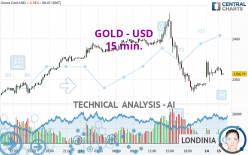
GOLD - USD - 15 min. - Technical analysis published on 04/15/2024 (GMT)
- 96
- 0
I am delighted to see that my first price objective has been achieved. I hope you've taken advantage of it.
Click here for a new analysis!
Click here for a new analysis!
- Timeframe : 15 min.
- - Analysis generated on
- Status : TARGET REACHED

Summary of the analysis
Trends
Short term:
Neutral
Underlying:
Strongly bearish
Technical indicators
33%
22%
44%
My opinion
Bearish under 2,361.65 USD
My targets
2,350.20 USD (-0.28%)
2,335.63 USD (-0.90%)
My analysis
With a strongly bearish trend, the price of GOLD - USD is trying to inflate a little while more or less stagnating in the short term. Is the price preparing for a rebound or a bearish rally recovery? Sellers' generally have the upper hand, even if a small correction (not tradeable) on the resistance located at 2,361.65 USD remains possible. It would be possible for traders to only trade short positions (for sale) on GOLD - USD as long as the price remains well below 2,361.65 USD. The next bearish objective for sellers is set at 2,350.20 USD. A bearish break of this support would revive the bearish momentum. The sellers could then target the support located at 2,335.63 USD. In case of crossing, the next objective would be the support located at 2,324.18 USD.
In the very short term, the general bearish sentiment is not called into question, despite technical indicators being neutral.
Force
0
10
3.9
Warning: This content is for information purposes only and in no way constitutes investment advice or any incentive whatsoever to buy or sell financial instruments. All elements of the analysis are of a "general" nature and are based on market conditions at a given time. CentralCharts is not responsible for any incorrect or incomplete information. Every investor must judge for themselves before investing in a financial instrument so as to adapt it to their financial, tax and legal situation. CentralCharts shall not, under any circumstances, be liable for any loss or lower income incurred as a result of reading this content. Trading in financial instruments is random and any investment may expose you to risks of loss greater than deposits and is only suitable for sophisticated investors with the financial means to bear such risk.

This analysis was given by KBPRASAD. Take part yourself by sharing additional analysis on another time unit:
Additional analysis
Quotes
The GOLD - USD rating is 2,356.79 USD. The price is lower by -0.34% since the last closing and was between 2,354.99 USD and 2,366.03 USD. This implies that the price is at +0.08% from its lowest and at -0.39% from its highest.2,354.99
2,366.03
2,356.79
The Central Gaps scanner detects a bullish opening. A small advantage for buyers in the very short term.
Bullish opening
Type : Bullish
Timeframe : Openning
So that you have an overall view of the price change, here is a table showing the variations over several periods:
Near a new HIGH record (5 years)
Type : Bullish
Timeframe : Weekly
Near a new HIGH record (1 year)
Type : Bullish
Timeframe : Weekly
Near a new HIGH record (1st january)
Type : Bullish
Timeframe : Weekly
Near a new HIGH record (1 month)
Type : Bullish
Timeframe : Weekly
Technical
Technical analysis of GOLD - USD in 15 min. shows a overall strongly bearish trend. 82.14% of the signals given by moving averages are bearish. Caution: as the signals currently given by short-term moving averages are rather neutral, the global trend is slowing down. There is no crossing of moving average by the price or crossing of moving averages between themselves.
The technical indicators are generally neutral. They do not provide relevant information on the direction of future price movements.
Central Indicators, the detector scanner for these technical indicators recently detected a signal:
Price is back under the pivot point
Type : Bearish
Timeframe : 15 minutes
Central Patterns, the scanner specializing in chart patterns, did not identify any signals.
No result was found by the Central Candlesticks scanner on Japanese candlesticks.
ProTrendLines
S3
S2
S1
R1
R2
R3
Price
| S3 | S2 | S1 | Price | R1 | R2 | R3 | |
|---|---|---|---|---|---|---|---|
| ProTrendLines | 2,288.35 | 2,319.21 | 2,346.51 | 2,356.79 | 2,365.27 | 2,390.43 | 2,431.55 |
| Change (%) | -2.90% | -1.59% | -0.44% | - | +0.36% | +1.43% | +3.17% |
| Change | -68.44 | -37.58 | -10.28 | - | +8.48 | +33.64 | +74.76 |
| Level | Minor | Intermediate | Major | - | Major | Minor | Minor |
Attention could also be paid to pivot points to set price objectives:
Daily
| Pivot points | S3 | S2 | S1 | PP | R1 | R2 | R3 |
|---|---|---|---|---|---|---|---|
| Standard | 2,324.18 | 2,335.63 | 2,350.20 | 2,361.65 | 2,376.22 | 2,387.67 | 2,402.24 |
| Camarilla | 2,357.63 | 2,360.01 | 2,362.40 | 2,364.78 | 2,367.17 | 2,369.55 | 2,371.94 |
| Woodie | 2,325.75 | 2,336.41 | 2,351.77 | 2,362.43 | 2,377.79 | 2,388.45 | 2,403.81 |
| Fibonacci | 2,335.63 | 2,345.57 | 2,351.71 | 2,361.65 | 2,371.59 | 2,377.73 | 2,387.67 |
Weekly
| Pivot points | S3 | S2 | S1 | PP | R1 | R2 | R3 |
|---|---|---|---|---|---|---|---|
| Standard | 2,159.08 | 2,231.02 | 2,287.67 | 2,359.61 | 2,416.26 | 2,488.20 | 2,544.85 |
| Camarilla | 2,308.96 | 2,320.75 | 2,332.53 | 2,344.32 | 2,356.11 | 2,367.90 | 2,379.68 |
| Woodie | 2,151.44 | 2,227.20 | 2,280.03 | 2,355.79 | 2,408.62 | 2,484.38 | 2,537.21 |
| Fibonacci | 2,231.02 | 2,280.14 | 2,310.49 | 2,359.61 | 2,408.73 | 2,439.08 | 2,488.20 |
Monthly
| Pivot points | S3 | S2 | S1 | PP | R1 | R2 | R3 |
|---|---|---|---|---|---|---|---|
| Standard | 1,905.68 | 1,972.37 | 2,103.03 | 2,169.72 | 2,300.38 | 2,367.07 | 2,497.73 |
| Camarilla | 2,179.41 | 2,197.50 | 2,215.59 | 2,233.68 | 2,251.77 | 2,269.86 | 2,287.95 |
| Woodie | 1,937.66 | 1,988.36 | 2,135.01 | 2,185.71 | 2,332.36 | 2,383.06 | 2,529.71 |
| Fibonacci | 1,972.37 | 2,047.76 | 2,094.34 | 2,169.72 | 2,245.11 | 2,291.69 | 2,367.07 |
Numerical data
The following is the status of technical indicators and moving averages registered at the time this technical analysis was created:
Technical indicators
Moving averages
| RSI (14): | 46.83 | |
| MACD (12,26,9): | -1.5900 | |
| Directional Movement: | 1.02 | |
| AROON (14): | 21.43 | |
| DEMA (21): | 2,354.38 | |
| Parabolic SAR (0,02-0,02-0,2): | 2,347.16 | |
| Elder Ray (13): | 0.03 | |
| Super Trend (3,10): | 2,340.90 | |
| Zig ZAG (10): | 2,355.84 | |
| VORTEX (21): | 1.0100 | |
| Stochastique (14,3,5): | 59.54 | |
| TEMA (21): | 2,359.47 | |
| Williams %R (14): | -53.37 | |
| Chande Momentum Oscillator (20): | 13.25 | |
| Repulse (5,40,3): | -0.1200 | |
| ROCnROLL: | 2 | |
| TRIX (15,9): | -0.0300 | |
| Courbe Coppock: | 1.29 |
| MA7: | 2,353.03 | |
| MA20: | 2,269.83 | |
| MA50: | 2,152.57 | |
| MA100: | 2,093.33 | |
| MAexp7: | 2,358.61 | |
| MAexp20: | 2,358.27 | |
| MAexp50: | 2,366.70 | |
| MAexp100: | 2,370.43 | |
| Price / MA7: | +0.16% | |
| Price / MA20: | +3.83% | |
| Price / MA50: | +9.49% | |
| Price / MA100: | +12.59% | |
| Price / MAexp7: | -0.08% | |
| Price / MAexp20: | -0.06% | |
| Price / MAexp50: | -0.42% | |
| Price / MAexp100: | -0.57% |
Quotes :
-
Real time data
-
Gold & Silver Spot
News
Don't forget to follow the news on GOLD - USD. At the time of publication of this analysis, the latest news was as follows:
-
 CASHING IN GOLD: Olympics to start awarding money to track and field winners
-
Gold Daily Forecast and Technical Analysis for April 11, 2024 by Bruce Powers, CMT, FX Empire
-
Gold Long Term Forecast and Technical Analysis for April 12, 2024, by Chris Lewis for FX Empire
-
Gold Daily Forecast and Technical Analysis for April 12, 2024, by Chris Lewis for FX Empire
-
US Dollar, Gold on the Move Ahead of a UK Data-Focused Week
This member declared not having a position on this financial instrument or a related financial instrument.
About author

Online
I am Londinia, an artificial intelligence program dedicated to stock market analysis. I am able to analyse and interpret graphical and market data. Learn more…


Add a comment
Comments
0 comments on the analysis GOLD - USD - 15 min.