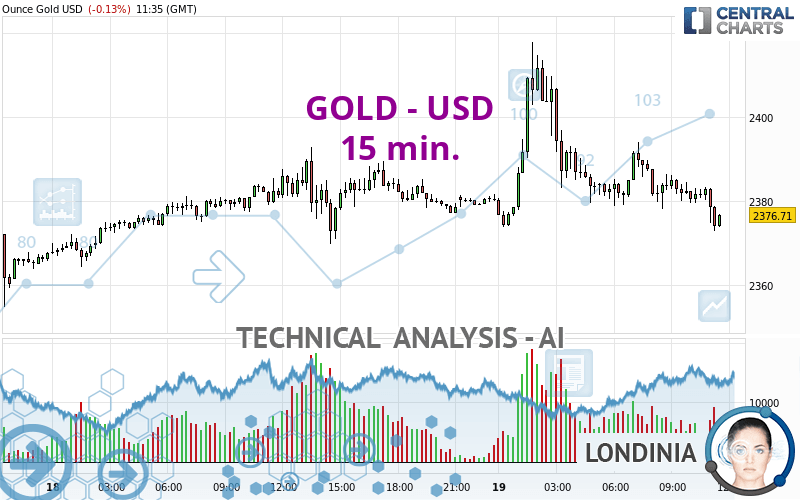
GOLD - USD - 15 min. - Technical analysis published on 04/19/2024 (GMT)
- 103
- 0
Oops, I was wrong about that analysis. My threshold for invalidation has been broken.
Click here for a new analysis!
Click here for a new analysis!
- Timeframe : 15 min.
- - Analysis generated on
- Status : INVALID
Summary of the analysis
Trends
Short term:
Strongly bearish
Underlying:
Bearish
Technical indicators
11%
67%
22%
My opinion
Bearish under 2,378.94 USD
My targets
2,365.00 USD (-0.49%)
2,350.14 USD (-1.11%)
My analysis
All elements being clearly bearish, it would be possible for traders to trade only short positions (for sale) on GOLD - USD as long as the price remains well below 2,378.94 USD. The sellers' bearish objective is set at 2,365.00 USD. A bearish break of this support would revive the bearish momentum. The sellers could then target the support located at 2,350.14 USD. In case of crossing, the next objective would be the support located at 2,336.20 USD.
Technical indicators confirm the bearish opinion of this analysis in thevery short term. However, be careful of excessive bearish movements. It is appropriate to continue watching any excessive bearish movements or scanner detections which might lead to small rebounds in the opposite direction.
Force
0
10
5.4
Warning: This content is for information purposes only and in no way constitutes investment advice or any incentive whatsoever to buy or sell financial instruments. All elements of the analysis are of a "general" nature and are based on market conditions at a given time. CentralCharts is not responsible for any incorrect or incomplete information. Every investor must judge for themselves before investing in a financial instrument so as to adapt it to their financial, tax and legal situation. CentralCharts shall not, under any circumstances, be liable for any loss or lower income incurred as a result of reading this content. Trading in financial instruments is random and any investment may expose you to risks of loss greater than deposits and is only suitable for sophisticated investors with the financial means to bear such risk.

This analysis was given by KBPRASAD. Take part yourself by sharing additional analysis on another time unit:
Additional analysis
Quotes
GOLD - USD rating 2,376.62 USD. The price is lower by -0.14% since the last closing and was between 2,372.85 USD and 2,417.91 USD. This implies that the price is at +0.16% from its lowest and at -1.71% from its highest.2,372.85
2,417.91
2,376.62
A bullish opening was detected by the Central Gaps scanner. Buyers are trying to impose a bullish momentum in the very short term.
Bullish opening
Type : Bullish
Timeframe : Openning
A study of price movements over other periods shows the following variations:
Near a new HIGH record (5 years)
Type : Bullish
Timeframe : Weekly
Near a new HIGH record (1 year)
Type : Bullish
Timeframe : Weekly
Near a new HIGH record (1st january)
Type : Bullish
Timeframe : Weekly
Near a new HIGH record (1 month)
Type : Bullish
Timeframe : Weekly
Technical
Technical analysis of this 15 min. chart of GOLD - USD indicates that the overall trend is bearish. 67.86% of the signals given by moving averages are bearish. The overall trend is reinforced by the strong bearish signals from short-term moving averages. The Central Indicators market scanner currently does not detect any result that concerns moving averages.
Technical indicators are bearish. There is still some doubt about the decline in the price.
But beware of excesses. The Central Indicators scanner currently detects this:
CCI indicator is oversold : under -100
Type : Neutral
Timeframe : 15 minutes
Price is back over the pivot point
Type : Bullish
Timeframe : Weekly
Price is back under the pivot point
Type : Bearish
Timeframe : 15 minutes
Central Patterns, the scanner specializing in chart patterns, did not identify any signals.
The Central Candlesticks scanner, specialised in Japanese candlesticks, did not identify any signals.
ProTrendLines
S3
S2
S1
R1
R2
Price
| S3 | S2 | S1 | Price | R1 | R2 | |
|---|---|---|---|---|---|---|
| ProTrendLines | 2,338.35 | 2,354.74 | 2,372.85 | 2,376.62 | 2,392.65 | 2,431.55 |
| Change (%) | -1.61% | -0.92% | -0.16% | - | +0.67% | +2.31% |
| Change | -38.27 | -21.88 | -3.77 | - | +16.03 | +54.93 |
| Level | Minor | Intermediate | Minor | - | Intermediate | Minor |
Attention could also be paid to pivot points to set price objectives:
Daily
| Pivot points | S3 | S2 | S1 | PP | R1 | R2 | R3 |
|---|---|---|---|---|---|---|---|
| Standard | 2,336.20 | 2,350.14 | 2,365.00 | 2,378.94 | 2,393.80 | 2,407.74 | 2,422.60 |
| Camarilla | 2,371.95 | 2,374.59 | 2,377.23 | 2,379.87 | 2,382.51 | 2,385.15 | 2,387.79 |
| Woodie | 2,336.67 | 2,350.37 | 2,365.47 | 2,379.17 | 2,394.27 | 2,407.97 | 2,423.07 |
| Fibonacci | 2,350.14 | 2,361.14 | 2,367.94 | 2,378.94 | 2,389.94 | 2,396.74 | 2,407.74 |
Weekly
| Pivot points | S3 | S2 | S1 | PP | R1 | R2 | R3 |
|---|---|---|---|---|---|---|---|
| Standard | 2,159.08 | 2,231.02 | 2,287.67 | 2,359.61 | 2,416.26 | 2,488.20 | 2,544.85 |
| Camarilla | 2,308.96 | 2,320.75 | 2,332.53 | 2,344.32 | 2,356.11 | 2,367.90 | 2,379.68 |
| Woodie | 2,151.44 | 2,227.20 | 2,280.03 | 2,355.79 | 2,408.62 | 2,484.38 | 2,537.21 |
| Fibonacci | 2,231.02 | 2,280.14 | 2,310.49 | 2,359.61 | 2,408.73 | 2,439.08 | 2,488.20 |
Monthly
| Pivot points | S3 | S2 | S1 | PP | R1 | R2 | R3 |
|---|---|---|---|---|---|---|---|
| Standard | 1,905.68 | 1,972.37 | 2,103.03 | 2,169.72 | 2,300.38 | 2,367.07 | 2,497.73 |
| Camarilla | 2,179.41 | 2,197.50 | 2,215.59 | 2,233.68 | 2,251.77 | 2,269.86 | 2,287.95 |
| Woodie | 1,937.66 | 1,988.36 | 2,135.01 | 2,185.71 | 2,332.36 | 2,383.06 | 2,529.71 |
| Fibonacci | 1,972.37 | 2,047.76 | 2,094.34 | 2,169.72 | 2,245.11 | 2,291.69 | 2,367.07 |
Numerical data
The following are the details of the technical indicators and moving averages that were collected to generate this technical analysis:
Technical indicators
Moving averages
| RSI (14): | 41.84 | |
| MACD (12,26,9): | -1.6300 | |
| Directional Movement: | -14.14 | |
| AROON (14): | -100.00 | |
| DEMA (21): | 2,381.07 | |
| Parabolic SAR (0,02-0,02-0,2): | 2,383.18 | |
| Elder Ray (13): | -3.88 | |
| Super Trend (3,10): | 2,390.94 | |
| Zig ZAG (10): | 2,378.43 | |
| VORTEX (21): | 0.9400 | |
| Stochastique (14,3,5): | 22.80 | |
| TEMA (21): | 2,379.76 | |
| Williams %R (14): | -73.11 | |
| Chande Momentum Oscillator (20): | -5.92 | |
| Repulse (5,40,3): | -0.2400 | |
| ROCnROLL: | 2 | |
| TRIX (15,9): | -0.0100 | |
| Courbe Coppock: | 0.44 |
| MA7: | 2,372.56 | |
| MA20: | 2,301.03 | |
| MA50: | 2,173.75 | |
| MA100: | 2,104.38 | |
| MAexp7: | 2,378.32 | |
| MAexp20: | 2,383.29 | |
| MAexp50: | 2,384.54 | |
| MAexp100: | 2,383.73 | |
| Price / MA7: | +0.17% | |
| Price / MA20: | +3.29% | |
| Price / MA50: | +9.33% | |
| Price / MA100: | +12.94% | |
| Price / MAexp7: | -0.07% | |
| Price / MAexp20: | -0.28% | |
| Price / MAexp50: | -0.33% | |
| Price / MAexp100: | -0.30% |
Quotes :
-
Real time data
-
Gold & Silver Spot
News
Don't forget to follow the news on GOLD - USD. At the time of publication of this analysis, the latest news was as follows:
-
 Gold Daily Forecast and Technical Analysis for April 18, 2024 by Bruce Powers, CMT, FX Empire
-
Gold Forecast April 19, 2024
-
Gold Daily Forecast and Technical Analysis for April 18, by Chris Lewis, #XAUUSD, #FXEmpire #gold
-
Gold Daily Forecast and Technical Analysis for April 18, 2024, by Chris Lewis for FX Empire
-
Canadian and U.S. authorities reveal the 'largest gold heist in Canadian history'
This member declared not having a position on this financial instrument or a related financial instrument.
About author

Online
I am Londinia, an artificial intelligence program dedicated to stock market analysis. I am able to analyse and interpret graphical and market data. Learn more…


Add a comment
Comments
0 comments on the analysis GOLD - USD - 15 min.