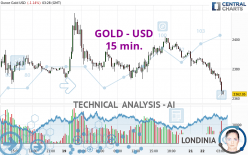
GOLD - USD - 15 min. - Technical analysis published on 04/22/2024 (GMT)
- 88
- 0
Click here for a new analysis!
- Timeframe : 15 min.
- - Analysis generated on
- Status : LEVEL MAINTAINED

Summary of the analysis

Additional analysis
Quotes
GOLD - USD rating 2,362.97 USD. On the day, this instrument lost -1.14% and was between 2,362.12 USD and 2,391.90 USD. This implies that the price is at +0.04% from its lowest and at -1.21% from its highest.A bullish opening was detected by the Central Gaps scanner. Buyers are trying to impose a bullish momentum in the very short term.
Bullish opening
Type : Bullish
Timeframe : Openning
A study of price movements over other periods shows the following variations:
Near a new HIGH record (5 years)
Type : Bullish
Timeframe : Weekly
Near a new HIGH record (1 year)
Type : Bullish
Timeframe : Weekly
Near a new HIGH record (1st january)
Type : Bullish
Timeframe : Weekly
Near a new HIGH record (1 month)
Type : Bullish
Timeframe : Weekly
Technical
Technical analysis of this 15 min. chart of GOLD - USD indicates that the overall trend is strongly bearish. 89.29% of the signals given by moving averages are bearish. This strongly bearish trend is supported by the strong bearish signals given by short-term moving averages. The Central Indicators market scanner currently does not detect any result that concerns moving averages.
In fact, 14 technical indicators on 18 studied are currently bearish. Caution: the Central Indicators scanner currently detects an excess:
RSI indicator is oversold : under 30
Type : Neutral
Timeframe : 15 minutes
CCI indicator is oversold : under -100
Type : Neutral
Timeframe : 15 minutes
Williams %R indicator is oversold : under -80
Type : Neutral
Timeframe : 15 minutes
Pivot points : price is under support 1
Type : Neutral
Timeframe : 15 minutes
Price is back under the pivot point
Type : Bearish
Timeframe : Weekly
The analysis of the price chart with Central Patterns scanners does not return any result.
The Central Candlesticks scanner currently notes the presence of this pattern in Japanese candlesticks that could mark the end of the short-term trend currently underway:
Black hanging man / hammer
Type : Neutral
Timeframe : 15 minutes
| S3 | S2 | S1 | Price | R1 | R2 | R3 | |
|---|---|---|---|---|---|---|---|
| ProTrendLines | 2,203.99 | 2,324.92 | 2,354.74 | 2,362.97 | 2,373.07 | 2,389.75 | 2,398.33 |
| Change (%) | -6.73% | -1.61% | -0.35% | - | +0.43% | +1.13% | +1.50% |
| Change | -158.98 | -38.05 | -8.23 | - | +10.10 | +26.78 | +35.36 |
| Level | Intermediate | Intermediate | Minor | - | Major | Minor | Minor |
To determine price objectives, it is also possible to use the pivot points. Here is the price position in relation to pivot points:
| Pivot points | S3 | S2 | S1 | PP | R1 | R2 | R3 |
|---|---|---|---|---|---|---|---|
| Standard | 2,324.29 | 2,348.57 | 2,369.35 | 2,393.63 | 2,414.41 | 2,438.69 | 2,459.47 |
| Camarilla | 2,377.74 | 2,381.87 | 2,386.00 | 2,390.13 | 2,394.26 | 2,398.39 | 2,402.52 |
| Woodie | 2,322.54 | 2,347.70 | 2,367.60 | 2,392.76 | 2,412.66 | 2,437.82 | 2,457.72 |
| Fibonacci | 2,348.57 | 2,365.78 | 2,376.42 | 2,393.63 | 2,410.84 | 2,421.48 | 2,438.69 |
| Pivot points | S3 | S2 | S1 | PP | R1 | R2 | R3 |
|---|---|---|---|---|---|---|---|
| Standard | 2,245.34 | 2,285.41 | 2,337.77 | 2,377.84 | 2,430.20 | 2,470.27 | 2,522.63 |
| Camarilla | 2,364.71 | 2,373.19 | 2,381.66 | 2,390.13 | 2,398.60 | 2,407.08 | 2,415.55 |
| Woodie | 2,251.49 | 2,288.48 | 2,343.92 | 2,380.91 | 2,436.35 | 2,473.34 | 2,528.78 |
| Fibonacci | 2,285.41 | 2,320.72 | 2,342.53 | 2,377.84 | 2,413.15 | 2,434.96 | 2,470.27 |
| Pivot points | S3 | S2 | S1 | PP | R1 | R2 | R3 |
|---|---|---|---|---|---|---|---|
| Standard | 1,905.68 | 1,972.37 | 2,103.03 | 2,169.72 | 2,300.38 | 2,367.07 | 2,497.73 |
| Camarilla | 2,179.41 | 2,197.50 | 2,215.59 | 2,233.68 | 2,251.77 | 2,269.86 | 2,287.95 |
| Woodie | 1,937.66 | 1,988.36 | 2,135.01 | 2,185.71 | 2,332.36 | 2,383.06 | 2,529.71 |
| Fibonacci | 1,972.37 | 2,047.76 | 2,094.34 | 2,169.72 | 2,245.11 | 2,291.69 | 2,367.07 |
Numerical data
The following are the details of the technical indicators and moving averages that were collected to generate this technical analysis:
| RSI (14): | 26.10 | |
| MACD (12,26,9): | -4.0500 | |
| Directional Movement: | -26.96 | |
| AROON (14): | -100.00 | |
| DEMA (21): | 2,375.17 | |
| Parabolic SAR (0,02-0,02-0,2): | 2,377.34 | |
| Elder Ray (13): | -6.83 | |
| Super Trend (3,10): | 2,380.79 | |
| Zig ZAG (10): | 2,372.09 | |
| VORTEX (21): | 0.7000 | |
| Stochastique (14,3,5): | 7.36 | |
| TEMA (21): | 2,372.20 | |
| Williams %R (14): | -89.70 | |
| Chande Momentum Oscillator (20): | -12.72 | |
| Repulse (5,40,3): | -0.2900 | |
| ROCnROLL: | 2 | |
| TRIX (15,9): | -0.0200 | |
| Courbe Coppock: | 0.90 |
| MA7: | 2,373.10 | |
| MA20: | 2,311.79 | |
| MA50: | 2,180.86 | |
| MA100: | 2,107.74 | |
| MAexp7: | 2,372.49 | |
| MAexp20: | 2,379.87 | |
| MAexp50: | 2,384.04 | |
| MAexp100: | 2,384.85 | |
| Price / MA7: | -0.43% | |
| Price / MA20: | +2.21% | |
| Price / MA50: | +8.35% | |
| Price / MA100: | +12.11% | |
| Price / MAexp7: | -0.40% | |
| Price / MAexp20: | -0.71% | |
| Price / MAexp50: | -0.88% | |
| Price / MAexp100: | -0.92% |
News
Don't forget to follow the news on GOLD - USD. At the time of publication of this analysis, the latest news was as follows:
-
 Gold Long Term Forecast for April 21, by Chris Lewis, for #fxempire #trading #gold #xauusd
-
Team USA is preparing for the Paris Olympics and eyeing gold! | Nightly News: Kids Edition
-
Gold Daily Forecast and Technical Analysis for April 19, 2024 by Bruce Powers, CMT, FX Empire
-
Gold Forecast April 22, 2024
-
Gold Long Term Forecast and Technical Analysis for April 19, 2024, by Chris Lewis for FX Empire
About author

Online


Add a comment
Comments
0 comments on the analysis GOLD - USD - 15 min.