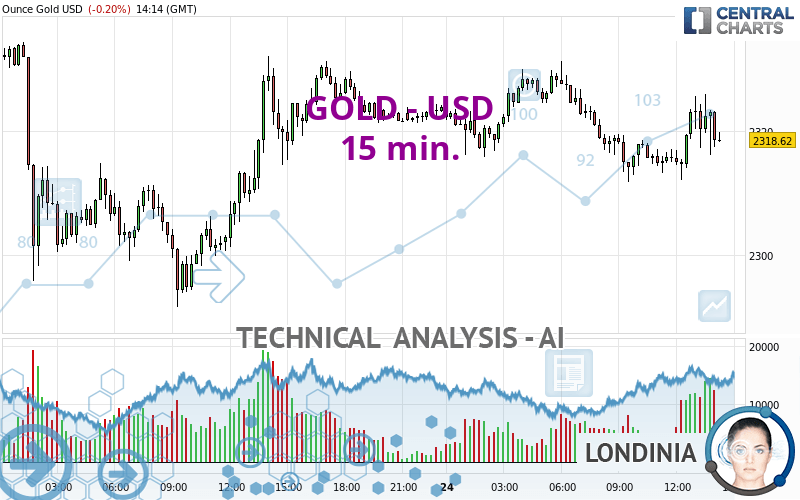
GOLD - USD - 15 min. - Technical analysis published on 04/24/2024 (GMT)
- Who voted?
- 82
- 0
- Timeframe : 15 min.
- - Analysis generated on
- Status : NEUTRAL
Summary of the analysis

Additional analysis
Quotes
The GOLD - USD rating is 2,318.63 USD. The price registered a decrease of -0.20% on the session with the lowest point at 2,311.81 USD and the highest point at 2,331.33 USD. The deviation from the price is +0.30% for the low point and -0.54% for the high point.A bullish opening was detected by the Central Gaps scanner. Buyers are trying to impose a bullish momentum in the very short term.
Bullish opening
Type : Bullish
Timeframe : Openning
A study of price movements over other periods shows the following variations:
Near a new HIGH record (5 years)
Type : Bullish
Timeframe : Weekly
Near a new HIGH record (1 year)
Type : Bullish
Timeframe : Weekly
Near a new HIGH record (1st january)
Type : Bullish
Timeframe : Weekly
Near a new HIGH record (1 month)
Type : Bullish
Timeframe : Weekly
Technical
Technical analysis of GOLD - USD in 15 min. shows an overall slightly bearish trend. 53.57% of the signals given by moving averages are bullish. As the signals currently given by short-term moving averages are rather neutral, the overall trend could quickly return to neutral as well. The Central Indicators market scanner is currently detecting several bearish signals that could impact this trend:
Bearish price crossover with Moving Average 50
Type : Bearish
Timeframe : 15 minutes
Bearish price crossover with adaptative moving average 20
Type : Bearish
Timeframe : 15 minutes
Bearish price crossover with adaptative moving average 50
Type : Bearish
Timeframe : 15 minutes
An assessment of technical indicators shows a slightly bullish signal.
Central Indicators, the scanner specialised in technical indicators, has identified these signals:
Pivot points : price is under support 1
Type : Neutral
Timeframe : Weekly
MACD indicator is back under 0
Type : Bearish
Timeframe : 15 minutes
Ichimoku - Bullish crossover : Tenkan & Kijun
Type : Bullish
Timeframe : 15 minutes
Central Patterns, the scanner specializing in chart patterns, did not identify any signals.
Central Candlesticks, the scanner specialised in Japanese candlesticks, detects a bullish signal that could support the hypothesis of a small rebound in the very short term:
Bullish engulfing lines
Type : Bullish
Timeframe : 15 minutes
| S3 | S2 | S1 | Price | R1 | R2 | R3 | |
|---|---|---|---|---|---|---|---|
| ProTrendLines | 2,079.55 | 2,203.99 | 2,291.48 | 2,318.63 | 2,324.42 | 2,373.14 | 2,392.70 |
| Change (%) | -10.31% | -4.94% | -1.17% | - | +0.25% | +2.35% | +3.19% |
| Change | -239.08 | -114.64 | -27.15 | - | +5.79 | +54.51 | +74.07 |
| Level | Minor | Intermediate | Intermediate | - | Minor | Intermediate | Minor |
Attention could also be paid to pivot points to set price objectives:
| Pivot points | S3 | S2 | S1 | PP | R1 | R2 | R3 |
|---|---|---|---|---|---|---|---|
| Standard | 2,255.36 | 2,273.42 | 2,298.37 | 2,316.43 | 2,341.38 | 2,359.44 | 2,384.39 |
| Camarilla | 2,311.49 | 2,315.44 | 2,319.38 | 2,323.32 | 2,327.26 | 2,331.21 | 2,335.15 |
| Woodie | 2,258.81 | 2,275.14 | 2,301.82 | 2,318.15 | 2,344.83 | 2,361.16 | 2,387.84 |
| Fibonacci | 2,273.42 | 2,289.85 | 2,300.00 | 2,316.43 | 2,332.86 | 2,343.01 | 2,359.44 |
| Pivot points | S3 | S2 | S1 | PP | R1 | R2 | R3 |
|---|---|---|---|---|---|---|---|
| Standard | 2,245.34 | 2,285.41 | 2,337.77 | 2,377.84 | 2,430.20 | 2,470.27 | 2,522.63 |
| Camarilla | 2,364.71 | 2,373.19 | 2,381.66 | 2,390.13 | 2,398.60 | 2,407.08 | 2,415.55 |
| Woodie | 2,251.49 | 2,288.48 | 2,343.92 | 2,380.91 | 2,436.35 | 2,473.34 | 2,528.78 |
| Fibonacci | 2,285.41 | 2,320.72 | 2,342.53 | 2,377.84 | 2,413.15 | 2,434.96 | 2,470.27 |
| Pivot points | S3 | S2 | S1 | PP | R1 | R2 | R3 |
|---|---|---|---|---|---|---|---|
| Standard | 1,905.68 | 1,972.37 | 2,103.03 | 2,169.72 | 2,300.38 | 2,367.07 | 2,497.73 |
| Camarilla | 2,179.41 | 2,197.50 | 2,215.59 | 2,233.68 | 2,251.77 | 2,269.86 | 2,287.95 |
| Woodie | 1,937.66 | 1,988.36 | 2,135.01 | 2,185.71 | 2,332.36 | 2,383.06 | 2,529.71 |
| Fibonacci | 1,972.37 | 2,047.76 | 2,094.34 | 2,169.72 | 2,245.11 | 2,291.69 | 2,367.07 |
Numerical data
The following is the status of the technical indicators and moving averages at the time of publication of this technical analysis:
| RSI (14): | 53.73 | |
| MACD (12,26,9): | -0.0200 | |
| Directional Movement: | 0.59 | |
| AROON (14): | 28.57 | |
| DEMA (21): | 2,318.77 | |
| Parabolic SAR (0,02-0,02-0,2): | 2,314.22 | |
| Elder Ray (13): | 2.64 | |
| Super Trend (3,10): | 2,311.66 | |
| Zig ZAG (10): | 2,326.00 | |
| VORTEX (21): | 1.0400 | |
| Stochastique (14,3,5): | 69.09 | |
| TEMA (21): | 2,319.95 | |
| Williams %R (14): | -22.25 | |
| Chande Momentum Oscillator (20): | 7.71 | |
| Repulse (5,40,3): | 0.1100 | |
| ROCnROLL: | 1 | |
| TRIX (15,9): | -0.0100 | |
| Courbe Coppock: | 0.34 |
| MA7: | 2,356.73 | |
| MA20: | 2,324.83 | |
| MA50: | 2,192.91 | |
| MA100: | 2,112.74 | |
| MAexp7: | 2,320.63 | |
| MAexp20: | 2,318.92 | |
| MAexp50: | 2,319.94 | |
| MAexp100: | 2,321.39 | |
| Price / MA7: | -1.62% | |
| Price / MA20: | -0.27% | |
| Price / MA50: | +5.73% | |
| Price / MA100: | +9.75% | |
| Price / MAexp7: | -0.09% | |
| Price / MAexp20: | -0.01% | |
| Price / MAexp50: | -0.06% | |
| Price / MAexp100: | -0.12% |
News
The latest news and videos published on GOLD - USD at the time of the analysis were as follows:
-
 Gold Daily Forecast and Technical Analysis for April 24, 2024, by Chris Lewis for FX Empire
-
Gold Daily Forecast and Technical Analysis for April 23, 2024 by Bruce Powers, CMT, FX Empire
-
Why traders are looking at Silver as the new Gold
-
Gold Daily Forecast and Technical Analysis for April 23, 2024, by Chris Lewis for FX Empire
-
Why Silver Could Outperform Gold
About author

Online


Add a comment
Comments
0 comments on the analysis GOLD - USD - 15 min.