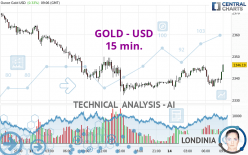
GOLD - USD - 15 min. - Technical analysis published on 05/14/2024 (GMT)
- 81
- 0
- Timeframe : 15 min.
- - Analysis generated on
- Status : NEUTRAL

Summary of the analysis

Additional analysis
Quotes
The GOLD - USD rating is 2,346.19 USD. On the day, this instrument gained +0.33% and was between 2,334.86 USD and 2,346.48 USD. This implies that the price is at +0.49% from its lowest and at -0.01% from its highest.The Central Gaps scanner detects a bullish opening marking the presence of buyers ahead of sellers at the opening but not sufficiently marked to allow the price to register a quotation gap.
Bullish opening
Type : Bullish
Timeframe : Openning
Here is a more detailed summary of the historical variations registered by GOLD - USD:
Near a new HIGH record (5 years)
Type : Bullish
Timeframe : Weekly
Near a new HIGH record (1 year)
Type : Bullish
Timeframe : Weekly
Near a new HIGH record (1st january)
Type : Bullish
Timeframe : Weekly
Near a new HIGH record (1 month)
Type : Bullish
Timeframe : Weekly
Technical
Technical analysis of this 15 min. chart of GOLD - USD indicates that the overall trend is not clearly defined. The slightly bullish signals currently given by short-term moving averages could allow the overall trend to return to a slightly bullish trend. The Central Indicators scanner detects bullish signals on moving averages that could impact this trend:
Bullish trend reversal : adaptative moving average 100
Type : Bullish
Timeframe : 15 minutes
Bullish price crossover with Moving Average 50
Type : Bullish
Timeframe : 15 minutes
On the 18 technical indicators analysed, 6 are bullish, 6 are neutral and 6 are bearish. Central Indicators, the scanner specialised in technical indicators, has identified these signals:
Parabolic SAR indicator bullish reversal
Type : Bullish
Timeframe : 15 minutes
Price is back under the pivot point
Type : Bearish
Timeframe : Weekly
Central Patterns, the scanner specializing in chart patterns, did not identify any signals.
For a small rebound in the very short term, the Central Candlesticks scanner currently notes the presence of this bullish pattern in Japanese candlesticks:
Bullish engulfing lines
Type : Bullish
Timeframe : 15 minutes
| S3 | S2 | S1 | Price | R1 | R2 | R3 | |
|---|---|---|---|---|---|---|---|
| ProTrendLines | 2,309.60 | 2,321.12 | 2,332.09 | 2,346.19 | 2,356.39 | 2,378.50 | 2,390.13 |
| Change (%) | -1.56% | -1.07% | -0.60% | - | +0.43% | +1.38% | +1.87% |
| Change | -36.59 | -25.07 | -14.10 | - | +10.20 | +32.31 | +43.94 |
| Level | Minor | Intermediate | Intermediate | - | Minor | Intermediate | Intermediate |
To determine price objectives, it is also possible to use the pivot points. Here is the price position in relation to pivot points:
| Pivot points | S3 | S2 | S1 | PP | R1 | R2 | R3 |
|---|---|---|---|---|---|---|---|
| Standard | 2,293.31 | 2,312.77 | 2,325.61 | 2,345.07 | 2,357.91 | 2,377.37 | 2,390.21 |
| Camarilla | 2,329.56 | 2,332.52 | 2,335.48 | 2,338.44 | 2,341.40 | 2,344.36 | 2,347.32 |
| Woodie | 2,289.99 | 2,311.12 | 2,322.29 | 2,343.42 | 2,354.59 | 2,375.72 | 2,386.89 |
| Fibonacci | 2,312.77 | 2,325.11 | 2,332.74 | 2,345.07 | 2,357.41 | 2,365.04 | 2,377.37 |
| Pivot points | S3 | S2 | S1 | PP | R1 | R2 | R3 |
|---|---|---|---|---|---|---|---|
| Standard | 2,224.09 | 2,257.98 | 2,310.73 | 2,344.62 | 2,397.37 | 2,431.26 | 2,484.01 |
| Camarilla | 2,339.66 | 2,347.61 | 2,355.55 | 2,363.49 | 2,371.43 | 2,379.37 | 2,387.32 |
| Woodie | 2,233.53 | 2,262.70 | 2,320.17 | 2,349.34 | 2,406.81 | 2,435.98 | 2,493.45 |
| Fibonacci | 2,257.98 | 2,291.07 | 2,311.52 | 2,344.62 | 2,377.71 | 2,398.16 | 2,431.26 |
| Pivot points | S3 | S2 | S1 | PP | R1 | R2 | R3 |
|---|---|---|---|---|---|---|---|
| Standard | 1,999.72 | 2,114.12 | 2,202.75 | 2,317.15 | 2,405.78 | 2,520.18 | 2,608.81 |
| Camarilla | 2,235.55 | 2,254.16 | 2,272.77 | 2,291.38 | 2,309.99 | 2,328.60 | 2,347.21 |
| Woodie | 1,986.84 | 2,107.68 | 2,189.87 | 2,310.71 | 2,392.90 | 2,513.74 | 2,595.93 |
| Fibonacci | 2,114.12 | 2,191.68 | 2,239.59 | 2,317.15 | 2,394.71 | 2,442.62 | 2,520.18 |
Numerical data
The following are the details of the technical indicators and moving averages that were collected to generate this technical analysis:
| RSI (14): | 42.34 | |
| MACD (12,26,9): | -0.7500 | |
| Directional Movement: | -10.31 | |
| AROON (14): | -50.00 | |
| DEMA (21): | 2,339.63 | |
| Parabolic SAR (0,02-0,02-0,2): | 2,341.44 | |
| Elder Ray (13): | -1.26 | |
| Super Trend (3,10): | 2,344.86 | |
| Zig ZAG (10): | 2,339.48 | |
| VORTEX (21): | 0.9300 | |
| Stochastique (14,3,5): | 32.08 | |
| TEMA (21): | 2,338.82 | |
| Williams %R (14): | -61.26 | |
| Chande Momentum Oscillator (20): | -5.44 | |
| Repulse (5,40,3): | 0.1000 | |
| ROCnROLL: | -1 | |
| TRIX (15,9): | 0.0000 | |
| Courbe Coppock: | 0.42 |
| MA7: | 2,334.96 | |
| MA20: | 2,333.70 | |
| MA50: | 2,274.55 | |
| MA100: | 2,155.14 | |
| MAexp7: | 2,339.96 | |
| MAexp20: | 2,340.15 | |
| MAexp50: | 2,340.61 | |
| MAexp100: | 2,342.60 | |
| Price / MA7: | +0.48% | |
| Price / MA20: | +0.54% | |
| Price / MA50: | +3.15% | |
| Price / MA100: | +8.86% | |
| Price / MAexp7: | +0.27% | |
| Price / MAexp20: | +0.26% | |
| Price / MAexp50: | +0.24% | |
| Price / MAexp100: | +0.15% |
News
The last news published on GOLD - USD at the time of the generation of this analysis was as follows:
-
 Gold Daily Forecast and Technical Analysis for May 13, 2024, by Chris Lewis for FX Empire
-
Gold Long Term Forecast for May 12, by Chris Lewis, for #fxempire #trading #gold #xauusd
-
Gold Daily Forecast and Technical Analysis for May 10, 2024 by Bruce Powers, CMT, FX Empire
-
Gold Long Term Forecast and Technical Analysis for May 10, 2024, by Chris Lewis for FX Empire
-
Gold Daily Forecast and Technical Analysis for May 10, 2024, by Chris Lewis for FX Empire
About author

Online


Add a comment
Comments
0 comments on the analysis GOLD - USD - 15 min.