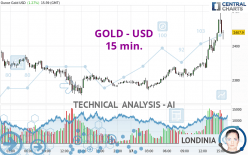
GOLD - USD - 15 min. - Technical analysis published on 05/17/2024 (GMT)
- 126
- 0
Click here for a new analysis!
- Timeframe : 15 min.
- - Analysis generated on
- Status : LEVEL MAINTAINED

Summary of the analysis

Additional analysis
Quotes
The GOLD - USD rating is 2,407.91 USD. The price registered an increase of +1.27% on the session with the lowest point at 2,373.97 USD and the highest point at 2,419.18 USD. The deviation from the price is +1.43% for the low point and -0.47% for the high point.The Central Gaps scanner detects a bullish opening. A small advantage for buyers in the very short term.
Bullish opening
Type : Bullish
Timeframe : Openning
Here is a more detailed summary of the historical variations registered by GOLD - USD:
Near a new HIGH record (5 years)
Type : Bullish
Timeframe : Weekly
Near a new HIGH record (1 year)
Type : Bullish
Timeframe : Weekly
Near a new HIGH record (1st january)
Type : Bullish
Timeframe : Weekly
New HIGH record (1 month)
Type : Bullish
Timeframe : Weekly
Technical
A technical analysis in 15 min. of this GOLD - USD chart shows a strongly bullish trend. The signals given by the moving averages are 92.86% bullish. This strong bullish trend is confirmed by the strong signals currently being given by short-term moving averages. The Central Indicators scanner does not detect any result on moving averages that would impact this trend.
The probability of a further increase is high given the direction of the technical indicators.
Caution: the Central Indicators scanner currently detects an excess:
RSI indicator is overbought : over 70
Type : Neutral
Timeframe : 15 minutes
CCI indicator: bearish divergence
Type : Bearish
Timeframe : 15 minutes
RSI indicator: bearish divergence
Type : Bearish
Timeframe : 15 minutes
Williams %R indicator is overbought : over -20
Type : Neutral
Timeframe : 15 minutes
Pivot points : price is over resistance 1
Type : Neutral
Timeframe : Weekly
Pivot points : price is over resistance 2
Type : Neutral
Timeframe : 15 minutes
The analysis of the price chart with Central Patterns scanners does not return any result.
The presence of a bearish pattern in Japanese candlesticks detected by Central Candlesticks that could cause a correction in the very short term was also detected:
Black gravestone / inverted hammer
Type : Bearish
Timeframe : 15 minutes
| S3 | S2 | S1 | Price | |
|---|---|---|---|---|
| ProTrendLines | 2,378.50 | 2,390.13 | 2,397.46 | 2,407.91 |
| Change (%) | -1.22% | -0.74% | -0.43% | - |
| Change | -29.41 | -17.78 | -10.45 | - |
| Level | Intermediate | Major | Intermediate | - |
To determine price objectives, it is also possible to use the pivot points. Here is the price position in relation to pivot points:
| Pivot points | S3 | S2 | S1 | PP | R1 | R2 | R3 |
|---|---|---|---|---|---|---|---|
| Standard | 2,340.28 | 2,355.65 | 2,366.73 | 2,382.10 | 2,393.18 | 2,408.55 | 2,419.63 |
| Camarilla | 2,370.55 | 2,372.97 | 2,375.40 | 2,377.82 | 2,380.25 | 2,382.67 | 2,385.09 |
| Woodie | 2,338.15 | 2,354.58 | 2,364.60 | 2,381.03 | 2,391.05 | 2,407.48 | 2,417.50 |
| Fibonacci | 2,355.65 | 2,365.75 | 2,371.99 | 2,382.10 | 2,392.20 | 2,398.44 | 2,408.55 |
| Pivot points | S3 | S2 | S1 | PP | R1 | R2 | R3 |
|---|---|---|---|---|---|---|---|
| Standard | 2,224.09 | 2,257.98 | 2,310.73 | 2,344.62 | 2,397.37 | 2,431.26 | 2,484.01 |
| Camarilla | 2,339.66 | 2,347.61 | 2,355.55 | 2,363.49 | 2,371.43 | 2,379.37 | 2,387.32 |
| Woodie | 2,233.53 | 2,262.70 | 2,320.17 | 2,349.34 | 2,406.81 | 2,435.98 | 2,493.45 |
| Fibonacci | 2,257.98 | 2,291.07 | 2,311.52 | 2,344.62 | 2,377.71 | 2,398.16 | 2,431.26 |
| Pivot points | S3 | S2 | S1 | PP | R1 | R2 | R3 |
|---|---|---|---|---|---|---|---|
| Standard | 1,999.72 | 2,114.12 | 2,202.75 | 2,317.15 | 2,405.78 | 2,520.18 | 2,608.81 |
| Camarilla | 2,235.55 | 2,254.16 | 2,272.77 | 2,291.38 | 2,309.99 | 2,328.60 | 2,347.21 |
| Woodie | 1,986.84 | 2,107.68 | 2,189.87 | 2,310.71 | 2,392.90 | 2,513.74 | 2,595.93 |
| Fibonacci | 2,114.12 | 2,191.68 | 2,239.59 | 2,317.15 | 2,394.71 | 2,442.62 | 2,520.18 |
Numerical data
The following is the status of technical indicators and moving averages registered at the time this technical analysis was created:
| RSI (14): | 82.00 | |
| MACD (12,26,9): | 7.2700 | |
| Directional Movement: | 33.93 | |
| AROON (14): | 71.43 | |
| DEMA (21): | 2,407.47 | |
| Parabolic SAR (0,02-0,02-0,2): | 2,403.24 | |
| Elder Ray (13): | 13.24 | |
| Super Trend (3,10): | 2,400.64 | |
| Zig ZAG (10): | 2,417.41 | |
| VORTEX (21): | 1.3300 | |
| Stochastique (14,3,5): | 92.14 | |
| TEMA (21): | 2,411.15 | |
| Williams %R (14): | -15.52 | |
| Chande Momentum Oscillator (20): | 25.80 | |
| Repulse (5,40,3): | 0.2000 | |
| ROCnROLL: | 1 | |
| TRIX (15,9): | 0.0300 | |
| Courbe Coppock: | 1.64 |
| MA7: | 2,368.90 | |
| MA20: | 2,336.20 | |
| MA50: | 2,289.56 | |
| MA100: | 2,165.03 | |
| MAexp7: | 2,406.56 | |
| MAexp20: | 2,398.84 | |
| MAexp50: | 2,390.70 | |
| MAexp100: | 2,386.08 | |
| Price / MA7: | +1.65% | |
| Price / MA20: | +3.07% | |
| Price / MA50: | +5.17% | |
| Price / MA100: | +11.22% | |
| Price / MAexp7: | +0.06% | |
| Price / MAexp20: | +0.38% | |
| Price / MAexp50: | +0.72% | |
| Price / MAexp100: | +0.91% |
News
Don't forget to follow the news on GOLD - USD. At the time of publication of this analysis, the latest news was as follows:
-
 Gold Daily Forecast and Technical Analysis for May 17, 2024, by Chris Lewis for FX Empire
-
Gold Daily Forecast and Technical Analysis for May 16, 2024 by Bruce Powers, CMT, FX Empire
-
Gold Forecast May 17, 2024
-
Gold Daily Forecast and Technical Analysis for May 16, 2024, by Chris Lewis for FX Empire
-
Gold Daily Forecast and Technical Analysis for May 15, by Bruce Powers, #CMT, #FXEmpire #gold
About author

Online


Add a comment
Comments
0 comments on the analysis GOLD - USD - 15 min.