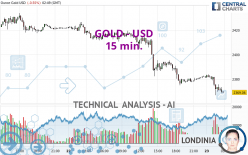
GOLD - USD - 15 min. - Technical analysis published on 05/23/2024 (GMT)
- 111
- 0
Click here for a new analysis!
- Timeframe : 15 min.
- - Analysis generated on
- Status : TARGET REACHED

Summary of the analysis

Additional analysis
Quotes
GOLD - USD rating 2,369.01 USD. The price is lower by -0.56% since the last closing and was between 2,366.76 USD and 2,383.80 USD. This implies that the price is at +0.10% from its lowest and at -0.62% from its highest.The Central Gaps scanner detects a bullish opening marking the presence of buyers ahead of sellers at the opening but not sufficiently marked to allow the price to register a quotation gap.
Bullish opening
Type : Bullish
Timeframe : Openning
Here is a more detailed summary of the historical variations registered by GOLD - USD:
New HIGH record (5 years)
Type : Bullish
Timeframe : Weekly
Near a new HIGH record (1 year)
Type : Bullish
Timeframe : Weekly
Near a new HIGH record (1st january)
Type : Bullish
Timeframe : Weekly
Near a new LOW record (1 month)
Type : Bearish
Timeframe : Weekly
Technical
Technical analysis of GOLD - USD in 15 min. shows a overall strongly bearish trend. 92.86% of the signals given by moving averages are bearish. The overall trend is supported by the strong bearish signals from short-term moving averages. There is no crossing of moving average by the price or crossing of moving averages between themselves.
Technical indicators are bearish. There is still some doubt about the decline in the price.
Caution: the Central Indicators scanner currently detects an excess:
RSI indicator is oversold : under 30
Type : Neutral
Timeframe : 15 minutes
CCI indicator is oversold : under -100
Type : Neutral
Timeframe : 15 minutes
Williams %R indicator is oversold : under -80
Type : Neutral
Timeframe : 15 minutes
Price is back under the pivot point
Type : Bearish
Timeframe : Weekly
The analysis of the price chart with Central Patterns scanners does not return any result.
Central Candlesticks, the scanner specialised in Japanese candlesticks, detects these signals that could have an impact on the current short-term trend:
Bullish harami
Type : Bullish
Timeframe : 15 minutes
Bullish harami cross
Type : Bullish
Timeframe : 15 minutes
Bearish engulfing lines
Type : Bearish
Timeframe : 15 minutes
| S3 | S2 | S1 | Price | R1 | R2 | R3 | |
|---|---|---|---|---|---|---|---|
| ProTrendLines | 2,183.68 | 2,332.24 | 2,351.89 | 2,369.01 | 2,374.45 | 2,390.13 | 2,406.65 |
| Change (%) | -7.82% | -1.55% | -0.72% | - | +0.23% | +0.89% | +1.59% |
| Change | -185.33 | -36.77 | -17.12 | - | +5.44 | +21.12 | +37.64 |
| Level | Minor | Intermediate | Minor | - | Intermediate | Intermediate | Intermediate |
To determine price objectives, it is also possible to use the pivot points. Here is the price position in relation to pivot points:
| Pivot points | S3 | S2 | S1 | PP | R1 | R2 | R3 |
|---|---|---|---|---|---|---|---|
| Standard | 2,310.97 | 2,342.97 | 2,362.62 | 2,394.62 | 2,414.27 | 2,446.27 | 2,465.92 |
| Camarilla | 2,368.08 | 2,372.81 | 2,377.55 | 2,382.28 | 2,387.02 | 2,391.75 | 2,396.48 |
| Woodie | 2,304.81 | 2,339.88 | 2,356.46 | 2,391.53 | 2,408.11 | 2,443.18 | 2,459.76 |
| Fibonacci | 2,342.97 | 2,362.70 | 2,374.89 | 2,394.62 | 2,414.35 | 2,426.54 | 2,446.27 |
| Pivot points | S3 | S2 | S1 | PP | R1 | R2 | R3 |
|---|---|---|---|---|---|---|---|
| Standard | 2,267.63 | 2,299.93 | 2,358.18 | 2,390.48 | 2,448.73 | 2,481.03 | 2,539.28 |
| Camarilla | 2,391.52 | 2,399.82 | 2,408.12 | 2,416.42 | 2,424.72 | 2,433.02 | 2,441.32 |
| Woodie | 2,280.60 | 2,306.42 | 2,371.15 | 2,396.97 | 2,461.70 | 2,487.52 | 2,552.25 |
| Fibonacci | 2,299.93 | 2,334.52 | 2,355.89 | 2,390.48 | 2,425.07 | 2,446.44 | 2,481.03 |
| Pivot points | S3 | S2 | S1 | PP | R1 | R2 | R3 |
|---|---|---|---|---|---|---|---|
| Standard | 1,999.72 | 2,114.12 | 2,202.75 | 2,317.15 | 2,405.78 | 2,520.18 | 2,608.81 |
| Camarilla | 2,235.55 | 2,254.16 | 2,272.77 | 2,291.38 | 2,309.99 | 2,328.60 | 2,347.21 |
| Woodie | 1,986.84 | 2,107.68 | 2,189.87 | 2,310.71 | 2,392.90 | 2,513.74 | 2,595.93 |
| Fibonacci | 2,114.12 | 2,191.68 | 2,239.59 | 2,317.15 | 2,394.71 | 2,442.62 | 2,520.18 |
Numerical data
The following is the status of technical indicators and moving averages registered at the time this technical analysis was created:
| RSI (14): | 32.02 | |
| MACD (12,26,9): | -3.4300 | |
| Directional Movement: | -16.15 | |
| AROON (14): | -42.86 | |
| DEMA (21): | 2,372.33 | |
| Parabolic SAR (0,02-0,02-0,2): | 2,379.47 | |
| Elder Ray (13): | -4.30 | |
| Super Trend (3,10): | 2,380.52 | |
| Zig ZAG (10): | 2,369.66 | |
| VORTEX (21): | 0.8500 | |
| Stochastique (14,3,5): | 25.21 | |
| TEMA (21): | 2,372.24 | |
| Williams %R (14): | -83.04 | |
| Chande Momentum Oscillator (20): | -12.66 | |
| Repulse (5,40,3): | -0.1500 | |
| ROCnROLL: | 2 | |
| TRIX (15,9): | -0.0200 | |
| Courbe Coppock: | 0.66 |
| MA7: | 2,397.92 | |
| MA20: | 2,351.63 | |
| MA50: | 2,307.95 | |
| MA100: | 2,178.83 | |
| MAexp7: | 2,371.84 | |
| MAexp20: | 2,377.23 | |
| MAexp50: | 2,384.94 | |
| MAexp100: | 2,395.12 | |
| Price / MA7: | -1.21% | |
| Price / MA20: | +0.74% | |
| Price / MA50: | +2.65% | |
| Price / MA100: | +8.73% | |
| Price / MAexp7: | -0.12% | |
| Price / MAexp20: | -0.35% | |
| Price / MAexp50: | -0.67% | |
| Price / MAexp100: | -1.09% |
News
The last news published on GOLD - USD at the time of the generation of this analysis was as follows:
-
 Gold Daily Forecast and Technical Analysis for May 22, 2024 by Bruce Powers, CMT, FX Empire
-
Gold Daily Forecast and Technical Analysis for May 22, by Chris Lewis, #XAUUSD, #FXEmpire #gold
-
Gold Daily Forecast and Technical Analysis for May 22, 2024, by Chris Lewis for FX Empire
-
Gold Daily Forecast and Technical Analysis for May 21, 2024 by Bruce Powers, CMT, FX Empire
-
Gold Daily Forecast and Technical Analysis for May 21, by Chris Lewis, #XAUUSD, #FXEmpire #gold
About author

Online


Add a comment
Comments
0 comments on the analysis GOLD - USD - 15 min.