GOLD - USD - Daily - Technical analysis published on 03/19/2020 (GMT)
- Who voted?
- 271
- 0
Click here for a new analysis!
- Timeframe : Daily
- - Analysis generated on
- Status : INVALID

Summary of the analysis

Additional analysis
Quotes
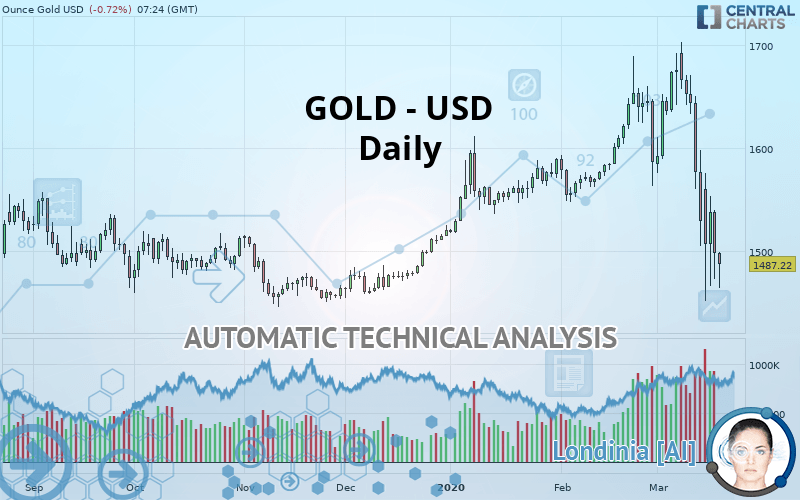
The GOLD - USD price is 1,487.03 USD. The price is lower by -0.73% since the last closing and was traded between 1,464.32 USD and 1,498.82 USD over the period. The price is currently at +1.55% from its lowest and -0.79% from its highest.The Central Gaps scanner detects a bullish opening marking the presence of buyers ahead of sellers at the opening but not sufficiently marked to allow the price to register a quotation gap.
Bullish opening
Type : Bullish
Timeframe : Openning
So that you have an overall view of the price change, here is a table showing the variations over several periods:
Near a new LOW record (1st january)
Type : Bearish
Timeframe : Weekly
Near a new LOW record (1 month)
Type : Bearish
Timeframe : Weekly
The Central Volumes scanner notes the presence of abnormal volumes:
Abnormal volumes
Timeframe : 5 days
Abnormal volumes
Timeframe : 20 days
Technical
A technical analysis in Daily of this GOLD - USD chart shows a bearish trend. The signals given by moving averages are 71.43% bearish. This bearish trend is reinforced by the strong signals currently being given by short-term moving averages. An assessment of moving averages reveals a bearish signal that could impact this trend:
Bearish price crossover with Moving Average 100
Type : Bearish
Timeframe : Daily
In fact, 14 technical indicators on 18 studied are currently bearish. Caution: the Central Indicators scanner currently detects an excess:
CCI indicator is oversold : under -100
Type : Neutral
Timeframe : Daily
Williams %R indicator is oversold : under -80
Type : Neutral
Timeframe : Daily
Ichimoku : price is under the cloud
Type : Bearish
Timeframe : Daily
Price is back under the pivot point
Type : Bearish
Timeframe : Daily
Price is back under the pivot point
Type : Bearish
Timeframe : Weekly
The analysis of the price chart with Central Patterns scanners does not return any result.
For a small setback in the very short term, the Central Candlesticks scanner currently notes the presence of this bearish pattern in Japanese candlesticks:
Bearish engulfing lines
Type : Bearish
Timeframe : Daily
| S3 | S2 | S1 | Price | R1 | R2 | R3 | |
|---|---|---|---|---|---|---|---|
| ProTrendLines | 1,385.54 | 1,412.81 | 1,454.01 | 1,487.03 | 1,513.35 | 1,546.29 | 1,595.11 |
| Change (%) | -6.83% | -4.99% | -2.22% | - | +1.77% | +3.99% | +7.27% |
| Change | -101.49 | -74.22 | -33.02 | - | +26.32 | +59.26 | +108.08 |
| Level | Minor | Minor | Major | - | Major | Major | Major |
To determine price objectives, it is also possible to use the pivot points. Here is the price position in relation to pivot points:
| Pivot points | S3 | S2 | S1 | PP | R1 | R2 | R3 |
|---|---|---|---|---|---|---|---|
| Standard | 1,400.56 | 1,436.77 | 1,467.40 | 1,503.61 | 1,534.24 | 1,570.45 | 1,601.08 |
| Camarilla | 1,479.65 | 1,485.78 | 1,491.90 | 1,498.03 | 1,504.16 | 1,510.28 | 1,516.41 |
| Woodie | 1,397.77 | 1,435.38 | 1,464.61 | 1,502.22 | 1,531.45 | 1,569.06 | 1,598.29 |
| Fibonacci | 1,436.77 | 1,462.30 | 1,478.08 | 1,503.61 | 1,529.14 | 1,544.92 | 1,570.45 |
| Pivot points | S3 | S2 | S1 | PP | R1 | R2 | R3 |
|---|---|---|---|---|---|---|---|
| Standard | 1,256.29 | 1,380.55 | 1,454.77 | 1,579.03 | 1,653.25 | 1,777.51 | 1,851.73 |
| Camarilla | 1,474.41 | 1,492.60 | 1,510.80 | 1,528.99 | 1,547.18 | 1,565.38 | 1,583.57 |
| Woodie | 1,231.27 | 1,368.04 | 1,429.75 | 1,566.52 | 1,628.23 | 1,765.00 | 1,826.71 |
| Fibonacci | 1,380.55 | 1,456.37 | 1,503.21 | 1,579.03 | 1,654.85 | 1,701.69 | 1,777.51 |
| Pivot points | S3 | S2 | S1 | PP | R1 | R2 | R3 |
|---|---|---|---|---|---|---|---|
| Standard | 1,384.41 | 1,465.97 | 1,526.28 | 1,607.84 | 1,668.15 | 1,749.71 | 1,810.02 |
| Camarilla | 1,547.59 | 1,560.59 | 1,573.60 | 1,586.60 | 1,599.61 | 1,612.61 | 1,625.61 |
| Woodie | 1,373.80 | 1,460.66 | 1,515.67 | 1,602.53 | 1,657.54 | 1,744.40 | 1,799.41 |
| Fibonacci | 1,465.97 | 1,520.16 | 1,553.64 | 1,607.84 | 1,662.03 | 1,695.51 | 1,749.71 |
Numerical data
The following is the status of the technical indicators and moving averages at the time of publication of this technical analysis:
| RSI (14): | 32.50 | |
| MACD (12,26,9): | -21.2500 | |
| Directional Movement: | -16.43 | |
| AROON (14): | -35.71 | |
| DEMA (21): | 1,561.86 | |
| Parabolic SAR (0,02-0,02-0,2): | 1,651.73 | |
| Elder Ray (13): | -83.89 | |
| Super Trend (3,10): | 1,648.27 | |
| Zig ZAG (10): | 1,484.94 | |
| VORTEX (21): | 0.8800 | |
| Stochastique (14,3,5): | 22.09 | |
| TEMA (21): | 1,528.99 | |
| Williams %R (14): | -86.64 | |
| Chande Momentum Oscillator (20): | -161.77 | |
| Repulse (5,40,3): | -2.9200 | |
| ROCnROLL: | 2 | |
| TRIX (15,9): | 0.0100 | |
| Courbe Coppock: | 10.63 |
| MA7: | 1,539.54 | |
| MA20: | 1,606.75 | |
| MA50: | 1,585.50 | |
| MA100: | 1,536.40 | |
| MAexp7: | 1,535.35 | |
| MAexp20: | 1,579.34 | |
| MAexp50: | 1,576.92 | |
| MAexp100: | 1,549.16 | |
| Price / MA7: | -3.41% | |
| Price / MA20: | -7.45% | |
| Price / MA50: | -6.21% | |
| Price / MA100: | -3.21% | |
| Price / MAexp7: | -3.15% | |
| Price / MAexp20: | -5.84% | |
| Price / MAexp50: | -5.70% | |
| Price / MAexp100: | -4.01% |
News
Don"t forget to follow the news on GOLD - USD. At the time of publication of this analysis, the latest news was as follows:
-
 Direxion Daily Junior Gold Miners Index Bear 3X Shares - JDST Stock Chart Technical Analysis for 03-
-
Direxion Daily Junior Gold Miners Index Bull 3X Shares - JNUG Stock Chart Technical Analysis for 03-
-
Gold and Silver Forecast March 19, 2020
-
Direxion Daily Gold Miners Index Bull 3X Shares - NUGT Stock Chart Technical Analysis for 03-18-2020
-
Direxion Daily Gold Miners Index Bear 3X Shares - DUST Stock Chart Technical Analysis for 03-18-2020
About author

Online


Add a comment
Comments
0 comments on the analysis GOLD - USD - Daily