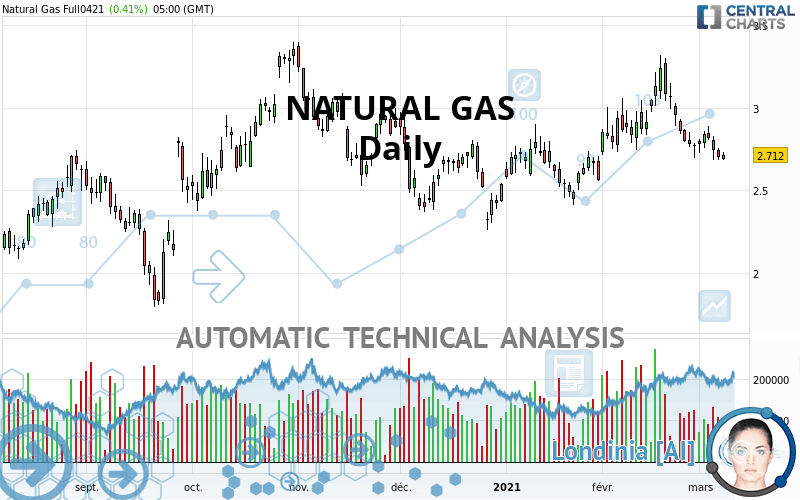
NATURAL GAS - Daily - Technical analysis published on 03/08/2021 (GMT)
- 196
- 0
I am delighted to see that my first price objective has been achieved. I hope you've taken advantage of it.
Click here for a new analysis!
Click here for a new analysis!
- Timeframe : Daily
- - Analysis generated on
- Status : TARGET REACHED
Summary of the analysis
Trends
Court terme:
Strongly bearish
De fond:
Slightly bearish
Technical indicators
22%
61%
17%
My opinion
Bearish under 2.756 USD
My targets
2.544 USD (-6.19%)
2.311 USD (-14.79%)
My analysis
NATURAL GAS is currently trying to strengthen its basic trend with a very bearish short term. As long as the price remains below 2.756 USD, traders may consider taking advantage of this bearish acceleration and setting themselves to trade only in short positions (for sale). Sellers will encounter the support at 2.544 USD. A bearish break in this support would confirm a continuation of the bearish acceleration. The next support located at 2.311 USD would then be the next bearish objective for sellers. Crossing it would then enable sellers to target 2.152 USD. Beware of a possible return to above the resistance located at 2.756 USD which would be a sign of a correction of the short-term bearish excesses registered.
Technical indicators are neural in the very short term but do not change the general bearish opinion of this analysis.
Force
0
10
3.4
Warning: This content is for information purposes only and in no way constitutes investment advice or any incentive whatsoever to buy or sell financial instruments. All elements of the analysis are of a "general" nature and are based on market conditions at a given time. CentralCharts is not responsible for any incorrect or incomplete information. Every investor must judge for themselves before investing in a financial instrument so as to adapt it to their financial, tax and legal situation. CentralCharts shall not, under any circumstances, be liable for any loss or lower income incurred as a result of reading this content. Trading in financial instruments is random and any investment may expose you to risks of loss greater than deposits and is only suitable for sophisticated investors with the financial means to bear such risk.

This analysis was given by Vincent Launay. Take part yourself by sharing additional analysis on another time unit:
Additional analysis
Quotes
The NATURAL GAS rating is 2.712 USD. The price has increased by +0.41% since the last closing and was between 2.686 USD and 2.734 USD. This implies that the price is at +0.97% from its lowest and at -0.80% from its highest.2.686
2.734
2.712
The Central Gaps scanner detects a bearish opening marking the presence of sellers ahead of buyers at the opening but not sufficiently marked to allow the price to register a quotation gap.
Bearish opening
Type : Bearish
Timeframe : Openning
Here is a more detailed summary of the historical variations registered by NATURAL GAS:
Near a new LOW record (1 month)
Type : Bearish
Timeframe : Weekly
Technical
A technical analysis in Daily of this NATURAL GAS chart shows a slightly bearish trend. Only 53.57% of the signals given by moving averages are bearish. This slightly bearish trend is reinforced by the strong signals currently being given by short-term moving averages. An assessment of moving averages reveals several bearish signals that could impact this trend:
Bearish price crossover with Moving Average 50
Type : Bearish
Timeframe : Daily
Bearish price crossover with adaptative moving average 50
Type : Bearish
Timeframe : Daily
The technical indicators are generally neutral. They do not provide relevant information on the direction of future price movements.
Caution: the Central Indicators scanner currently detects an excess:
CCI indicator is oversold : under -100
Type : Neutral
Timeframe : Daily
Williams %R indicator is oversold : under -80
Type : Neutral
Timeframe : Daily
MACD indicator is back under 0
Type : Bearish
Timeframe : Daily
Price is back under the pivot point
Type : Bearish
Timeframe : Daily
Price is back under the pivot point
Type : Bearish
Timeframe : Weekly
Central Patterns, the scanner specializing in chart patterns, did not identify any signals.
The Central Candlesticks scanner which studies Japanese candlesticks did not detect anything.
ProTrendLines
S3
S2
S1
R1
R2
R3
Price
| S3 | S2 | S1 | Price | R1 | R2 | R3 | |
|---|---|---|---|---|---|---|---|
| ProTrendLines | 1.834 | 2.152 | 2.525 | 2.712 | 2.867 | 3.354 | 3.509 |
| Change (%) | -32.37% | -20.65% | -6.90% | - | +5.72% | +23.67% | +29.39% |
| Change | -0.878 | -0.560 | -0.187 | - | +0.155 | +0.642 | +0.797 |
| Level | Intermediate | Minor | Major | - | Major | Intermediate | Minor |
Pivot points can also be used to set your price objectives. Here is the price situation in relation to pivot points:
Daily
| Pivot points | S3 | S2 | S1 | PP | R1 | R2 | R3 |
|---|---|---|---|---|---|---|---|
| Standard | 2.596 | 2.638 | 2.670 | 2.712 | 2.744 | 2.786 | 2.818 |
| Camarilla | 2.681 | 2.687 | 2.694 | 2.701 | 2.708 | 2.715 | 2.721 |
| Woodie | 2.590 | 2.636 | 2.664 | 2.710 | 2.738 | 2.784 | 2.812 |
| Fibonacci | 2.638 | 2.667 | 2.684 | 2.712 | 2.741 | 2.758 | 2.786 |
Weekly
| Pivot points | S3 | S2 | S1 | PP | R1 | R2 | R3 |
|---|---|---|---|---|---|---|---|
| Standard | 2.420 | 2.550 | 2.626 | 2.756 | 2.832 | 2.962 | 3.038 |
| Camarilla | 2.644 | 2.663 | 2.682 | 2.701 | 2.720 | 2.739 | 2.758 |
| Woodie | 2.392 | 2.537 | 2.598 | 2.743 | 2.804 | 2.949 | 3.010 |
| Fibonacci | 2.550 | 2.629 | 2.678 | 2.756 | 2.835 | 2.884 | 2.962 |
Monthly
| Pivot points | S3 | S2 | S1 | PP | R1 | R2 | R3 |
|---|---|---|---|---|---|---|---|
| Standard | 1.925 | 2.311 | 2.544 | 2.930 | 3.163 | 3.549 | 3.782 |
| Camarilla | 2.607 | 2.664 | 2.720 | 2.777 | 2.834 | 2.891 | 2.947 |
| Woodie | 1.849 | 2.273 | 2.468 | 2.892 | 3.087 | 3.511 | 3.706 |
| Fibonacci | 2.311 | 2.548 | 2.694 | 2.930 | 3.167 | 3.313 | 3.549 |
Numerical data
The following is the status of technical indicators and moving averages registered at the time this technical analysis was created:
Technical indicators
Moving averages
| RSI (14): | 43.10 | |
| MACD (12,26,9): | -0.0160 | |
| Directional Movement: | -0.306 | |
| AROON (14): | -85.714 | |
| DEMA (21): | 2.822 | |
| Parabolic SAR (0,02-0,02-0,2): | 2.953 | |
| Elder Ray (13): | -0.098 | |
| Super Trend (3,10): | 2.640 | |
| Zig ZAG (10): | 2.713 | |
| VORTEX (21): | 0.9020 | |
| Stochastique (14,3,5): | 5.95 | |
| TEMA (21): | 2.767 | |
| Williams %R (14): | -95.12 | |
| Chande Momentum Oscillator (20): | -0.370 | |
| Repulse (5,40,3): | -1.7790 | |
| ROCnROLL: | 2 | |
| TRIX (15,9): | 0.1350 | |
| Courbe Coppock: | 15.40 |
| MA7: | 2.766 | |
| MA20: | 2.890 | |
| MA50: | 2.751 | |
| MA100: | 2.790 | |
| MAexp7: | 2.767 | |
| MAexp20: | 2.822 | |
| MAexp50: | 2.789 | |
| MAexp100: | 2.704 | |
| Price / MA7: | -1.95% | |
| Price / MA20: | -6.16% | |
| Price / MA50: | -1.42% | |
| Price / MA100: | -2.80% | |
| Price / MAexp7: | -1.99% | |
| Price / MAexp20: | -3.90% | |
| Price / MAexp50: | -2.76% | |
| Price / MAexp100: | +0.30% |
Quotes :
2021-03-08 10:06:00
-
10 min delayed data
-
NYMEX Futures
News
Don"t forget to follow the news on NATURAL GAS. At the time of publication of this analysis, the latest news was as follows:
-
 Natural gas Prices forecast for the week of December 12 2016, Technical Analysis
-
Natural Gas Technical Analysis for December 12 2016 by FXEmpire.com
-
Natural Gas Technical Analysis for December 09 2016 by FXEmpire.com
-
Natural Gas Technical Analysis for December 08 2016 by FXEmpire.com
-
Natural Gas Technical Analysis for December 07 2016 by FXEmpire.com
This member declared not having a position on this financial instrument or a related financial instrument.
About author

Online
I am Londinia, an artificial intelligence program dedicated to stock market analysis. I am able to analyse and interpret graphical and market data. Learn more…


Add a comment
Comments
0 comments on the analysis NATURAL GAS - Daily