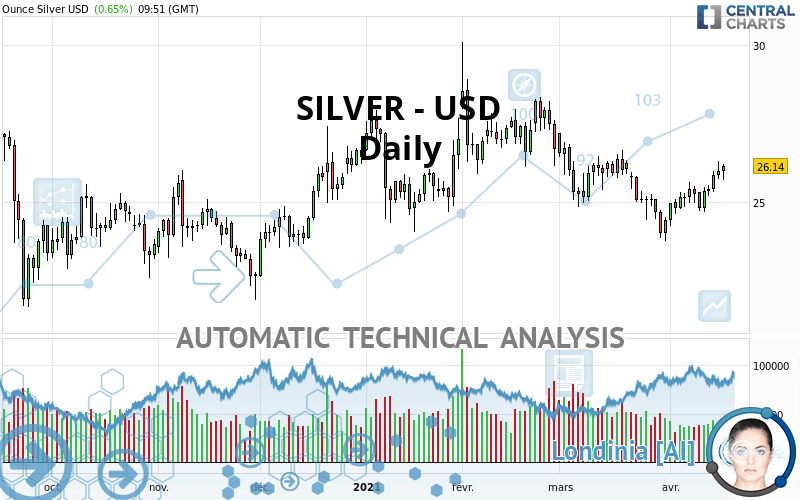
SILVER - USD - Daily - Technical analysis published on 04/19/2021 (GMT)
- 207
- 0
Click here for a new analysis!
- Timeframe : Daily
- - Analysis generated on
- Status : TARGET REACHED

Summary of the analysis

Additional analysis
Quotes
The SILVER - USD price is 26.14 USD. On the day, this instrument gained +0.66% with the lowest point at 25.70 USD and the highest point at 26.19 USD. The deviation from the price is +1.71% for the low point and -0.19% for the high point.The Central Gaps scanner detects a bullish opening. A small advantage for buyers in the very short term.
Bullish opening
Type : Bullish
Timeframe : Openning
So that you have an overall view of the price change, here is a table showing the variations over several periods:
Near a new HIGH record (1 month)
Type : Bullish
Timeframe : Weekly
Technical
Technical analysis of this Daily chart of SILVER - USD indicates that the overall trend is bullish. 67.86% of the signals given by moving averages are bullish. This bullish trend shows slight signs of slowing down given the slightly bullish signals given by the short-term moving averages. The Central Indicators scanner detects bullish signals on moving averages that could impact this trend:
Bullish price crossover with Moving Average 50
Type : Bullish
Timeframe : Daily
Bullish price crossover with adaptative moving average 50
Type : Bullish
Timeframe : Daily
The probability of a further increase is high given the direction of the technical indicators.
Caution: the Central Indicators scanner currently detects an excess:
CCI indicator is overbought : over 100
Type : Neutral
Timeframe : Daily
RSI indicator: bullish divergence
Type : Bullish
Timeframe : Daily
Williams %R indicator is overbought : over -20
Type : Neutral
Timeframe : Daily
Pivot points : price is over resistance 2
Type : Neutral
Timeframe : Weekly
Pivot points : price is over resistance 3
Type : Neutral
Timeframe : Daily
Pivot points : price is under support 3
Type : Neutral
Timeframe : Daily
Pivot points : price is under support 3
Type : Neutral
Timeframe : Weekly
No signals are given by Central Patterns, a market scanner specialised in chart patterns, resistances and supports.
The Central Candlesticks scanner which studies Japanese candlesticks did not detect anything.
| S3 | S2 | S1 | Price | R1 | R2 | R3 | |
|---|---|---|---|---|---|---|---|
| ProTrendLines | 22.65 | 24.02 | 25.16 | 26.14 | 26.35 | 27.59 | 28.53 |
| Change (%) | -13.35% | -8.11% | -3.75% | - | +0.80% | +5.55% | +9.14% |
| Change | -3.49 | -2.12 | -0.98 | - | +0.21 | +1.45 | +2.39 |
| Level | Major | Minor | Intermediate | - | Major | Minor | Intermediate |
Pivot points can also be used to set your price objectives. Here is the price situation in relation to pivot points:
| Pivot points | S3 | S2 | S1 | PP | R1 | R2 | R3 |
|---|---|---|---|---|---|---|---|
| Standard | 25.15 | 25.44 | 25.71 | 26.00 | 26.27 | 26.56 | 26.83 |
| Camarilla | 25.82 | 25.87 | 25.92 | 25.97 | 26.02 | 26.07 | 26.12 |
| Woodie | 25.13 | 25.44 | 25.69 | 26.00 | 26.25 | 26.56 | 26.81 |
| Fibonacci | 25.44 | 25.66 | 25.79 | 26.00 | 26.22 | 26.35 | 26.56 |
| Pivot points | S3 | S2 | S1 | PP | R1 | R2 | R3 |
|---|---|---|---|---|---|---|---|
| Standard | 23.38 | 24.03 | 25.00 | 25.65 | 26.62 | 27.27 | 28.24 |
| Camarilla | 25.53 | 25.67 | 25.82 | 25.97 | 26.12 | 26.27 | 26.42 |
| Woodie | 23.54 | 24.11 | 25.16 | 25.73 | 26.78 | 27.35 | 28.40 |
| Fibonacci | 24.03 | 24.65 | 25.03 | 25.65 | 26.27 | 26.65 | 27.27 |
| Pivot points | S3 | S2 | S1 | PP | R1 | R2 | R3 |
|---|---|---|---|---|---|---|---|
| Standard | 19.66 | 21.72 | 23.07 | 25.13 | 26.48 | 28.54 | 29.89 |
| Camarilla | 23.49 | 23.81 | 24.12 | 24.43 | 24.74 | 25.06 | 25.37 |
| Woodie | 19.32 | 21.54 | 22.73 | 24.95 | 26.14 | 28.36 | 29.55 |
| Fibonacci | 21.72 | 23.02 | 23.82 | 25.13 | 26.43 | 27.23 | 28.54 |
Numerical data
The following is the status of technical indicators and moving averages registered at the time this technical analysis was created:
| RSI (14): | 57.98 | |
| MACD (12,26,9): | -0.0200 | |
| Directional Movement: | 3.80 | |
| AROON (14): | 78.57 | |
| DEMA (21): | 25.36 | |
| Parabolic SAR (0,02-0,02-0,2): | 24.17 | |
| Elder Ray (13): | 0.46 | |
| Super Trend (3,10): | 26.35 | |
| Zig ZAG (10): | 26.15 | |
| VORTEX (21): | 0.9700 | |
| Stochastique (14,3,5): | 91.42 | |
| TEMA (21): | 25.55 | |
| Williams %R (14): | -6.72 | |
| Chande Momentum Oscillator (20): | 1.71 | |
| Repulse (5,40,3): | 2.8400 | |
| ROCnROLL: | 1 | |
| TRIX (15,9): | -0.1300 | |
| Courbe Coppock: | 4.81 |
| MA7: | 25.54 | |
| MA20: | 25.18 | |
| MA50: | 26.06 | |
| MA100: | 25.76 | |
| MAexp7: | 25.67 | |
| MAexp20: | 25.48 | |
| MAexp50: | 25.69 | |
| MAexp100: | 25.51 | |
| Price / MA7: | +2.35% | |
| Price / MA20: | +3.81% | |
| Price / MA50: | +0.31% | |
| Price / MA100: | +1.48% | |
| Price / MAexp7: | +1.83% | |
| Price / MAexp20: | +2.59% | |
| Price / MAexp50: | +1.75% | |
| Price / MAexp100: | +2.47% |
News
Don"t forget to follow the news on SILVER - USD. At the time of publication of this analysis, the latest news was as follows:
-
 Silver Prices forecast for the week of December 12 2016, Technical Analysis
-
Silver Technical Analysis for December 12 2016 by FXEmpire.com
-
Silver Technical Analysis for December 09 2016 by FXEmpire.com
-
Silver Technical Analysis for December 08 2016 by FXEmpire.com
-
Silver Technical Analysis for December 07 2016 by FXEmpire.com
About author

Online


Add a comment
Comments
0 comments on the analysis SILVER - USD - Daily