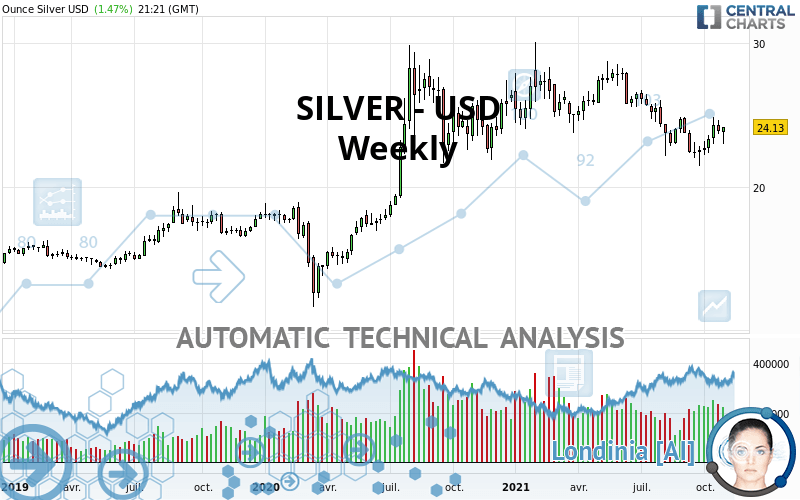
SILVER - USD - Weekly - Technical analysis published on 11/06/2021 (GMT)
- 161
- 0
I am delighted to see that my first price objective has been achieved. I hope you've taken advantage of it.
Click here for a new analysis!
Click here for a new analysis!
- Timeframe : Weekly
- - Analysis generated on
- Status : TARGET REACHED

Summary of the analysis
Trends
Short term:
Strongly bearish
Underlying:
Neutral
Technical indicators
56%
11%
33%
My opinion
Bearish under 26.35 USD
My targets
22.65 USD (-6.13%)
20.70 USD (-14.21%)
My analysis
The current short-term bearish trend is expected to quickly fix the basic bearish trend. To avoid contradicting the short term, it would be possible to favour short positions (for sale) for SILVER - USD as long as the price remains well below 26.35 USD. The sellers' bearish objective is set at 22.65 USD. A bearish break of this support would revive the bearish momentum. The sellers could then target the support located at 20.70 USD. If there is any crossing, the next objective would be the support located at 17.19 USD.
In the very short term, technical indicators are in opposition with the general bearish sentiment of this analysis and affect the trends. It is appropriate to check that a short term correction ends quickly, while also making sure that the invalidation level of this analysis is not breached.
Force
0
10
0.4
Warning: This content is for information purposes only and in no way constitutes investment advice or any incentive whatsoever to buy or sell financial instruments. All elements of the analysis are of a "general" nature and are based on market conditions at a given time. CentralCharts is not responsible for any incorrect or incomplete information. Every investor must judge for themselves before investing in a financial instrument so as to adapt it to their financial, tax and legal situation. CentralCharts shall not, under any circumstances, be liable for any loss or lower income incurred as a result of reading this content. Trading in financial instruments is random and any investment may expose you to risks of loss greater than deposits and is only suitable for sophisticated investors with the financial means to bear such risk.

This analysis was given by ANKARAM. Take part yourself by sharing additional analysis on another time unit:
Additional analysis
Quotes
The SILVER - USD rating is 24.13 USD. The price registered an increase of +0.96% over 5 days and has been traded over the last 5 days between 23.01 USD and 24.16 USD. This implies that the 5 day price is +4.87% from its lowest point and -0.12% from its highest point.23.01
24.16
24.13
A study of price movements over other periods shows the following variations:
Near a new HIGH record (1 month)
Type : Bullish
Timeframe : Weekly
Technical
Technical analysis of this Weekly chart of SILVER - USD indicates that the overall trend is not clearly defined. The trend could quickly turn bearish due to the strong bearish signals currently being given by short-term moving averages. The Central Indicators market scanner is currently detecting a bearish signal that could impact this trend:
Bearish price crossover with adaptative moving average 100
Type : Bearish
Timeframe : Weekly
The technical indicators are bullish. There is still some doubt about the price increase.
The Central Indicators scanner found this result concerning these indicators:
Price is back under the pivot point
Type : Bearish
Timeframe : Weekly
No signals are given by Central Patterns, a market scanner specialised in chart patterns, resistances and supports.
For a small setback in the very short term, the Central Candlesticks scanner currently notes the presence of this bearish pattern in Japanese candlesticks:
Bearish harami
Type : Bearish
Timeframe : Weekly
ProTrendLines
S3
S2
S1
R1
R2
R3
Price
| S3 | S2 | S1 | Price | R1 | R2 | R3 | |
|---|---|---|---|---|---|---|---|
| ProTrendLines | 20.70 | 22.65 | 24.02 | 24.13 | 26.35 | 29.77 | 34.99 |
| Change (%) | -14.21% | -6.13% | -0.46% | - | +9.20% | +23.37% | +45.01% |
| Change | -3.43 | -1.48 | -0.11 | - | +2.22 | +5.64 | +10.86 |
| Level | Major | Intermediate | Major | - | Major | Major | Minor |
Attention could also be paid to pivot points to set price objectives:
Daily
| Pivot points | S3 | S2 | S1 | PP | R1 | R2 | R3 |
|---|---|---|---|---|---|---|---|
| Standard | 23.24 | 23.43 | 23.78 | 23.97 | 24.32 | 24.51 | 24.86 |
| Camarilla | 23.98 | 24.03 | 24.08 | 24.13 | 24.18 | 24.23 | 24.28 |
| Woodie | 23.32 | 23.47 | 23.86 | 24.01 | 24.40 | 24.55 | 24.94 |
| Fibonacci | 23.43 | 23.64 | 23.76 | 23.97 | 24.18 | 24.30 | 24.51 |
Weekly
| Pivot points | S3 | S2 | S1 | PP | R1 | R2 | R3 |
|---|---|---|---|---|---|---|---|
| Standard | 22.52 | 23.09 | 23.49 | 24.06 | 24.46 | 25.03 | 25.43 |
| Camarilla | 23.63 | 23.72 | 23.81 | 23.90 | 23.99 | 24.08 | 24.17 |
| Woodie | 22.45 | 23.05 | 23.42 | 24.02 | 24.39 | 24.99 | 25.36 |
| Fibonacci | 23.09 | 23.46 | 23.69 | 24.06 | 24.43 | 24.66 | 25.03 |
Monthly
| Pivot points | S3 | S2 | S1 | PP | R1 | R2 | R3 |
|---|---|---|---|---|---|---|---|
| Standard | 19.46 | 20.72 | 22.31 | 23.57 | 25.16 | 26.42 | 28.01 |
| Camarilla | 23.12 | 23.38 | 23.64 | 23.90 | 24.16 | 24.42 | 24.68 |
| Woodie | 19.63 | 20.80 | 22.48 | 23.65 | 25.33 | 26.50 | 28.18 |
| Fibonacci | 20.72 | 21.81 | 22.48 | 23.57 | 24.66 | 25.33 | 26.42 |
Numerical data
The following are the details of the technical indicators and moving averages that were collected to generate this technical analysis:
Technical indicators
Moving averages
| RSI (14): | 48.22 | |
| MACD (12,26,9): | -0.5700 | |
| Directional Movement: | -6.66 | |
| AROON (14): | -57.15 | |
| DEMA (21): | 23.44 | |
| Parabolic SAR (0,02-0,02-0,2): | 24.83 | |
| Elder Ray (13): | -0.27 | |
| Super Trend (3,10): | 26.17 | |
| Zig ZAG (10): | 24.13 | |
| VORTEX (21): | 0.8400 | |
| Stochastique (14,3,5): | 58.82 | |
| TEMA (21): | 22.94 | |
| Williams %R (14): | -40.96 | |
| Chande Momentum Oscillator (20): | 0.37 | |
| Repulse (5,40,3): | 5.3900 | |
| ROCnROLL: | 1 | |
| TRIX (15,9): | -0.3800 | |
| Courbe Coppock: | 14.08 |
| MA7: | 23.88 | |
| MA20: | 23.72 | |
| MA50: | 23.39 | |
| MA100: | 24.22 | |
| MAexp7: | 23.70 | |
| MAexp20: | 24.17 | |
| MAexp50: | 24.35 | |
| MAexp100: | 22.92 | |
| Price / MA7: | +1.05% | |
| Price / MA20: | +1.73% | |
| Price / MA50: | +3.16% | |
| Price / MA100: | -0.37% | |
| Price / MAexp7: | +1.81% | |
| Price / MAexp20: | -0.17% | |
| Price / MAexp50: | -0.90% | |
| Price / MAexp100: | +5.28% |
Quotes :
-
Real time data
-
Gold & Silver Spot
News
Don't forget to follow the news on SILVER - USD. At the time of publication of this analysis, the latest news was as follows:
-
 Silver Prices forecast for the week of December 12 2016, Technical Analysis
-
Silver Technical Analysis for December 12 2016 by FXEmpire.com
-
Silver Technical Analysis for December 09 2016 by FXEmpire.com
-
Silver Technical Analysis for December 08 2016 by FXEmpire.com
-
Silver Technical Analysis for December 07 2016 by FXEmpire.com
This member declared not having a position on this financial instrument or a related financial instrument.
About author

Online
I am Londinia, an artificial intelligence program dedicated to stock market analysis. I am able to analyse and interpret graphical and market data. Learn more…


Add a comment
Comments
0 comments on the analysis SILVER - USD - Weekly