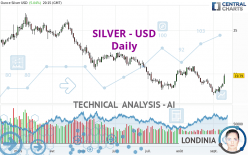
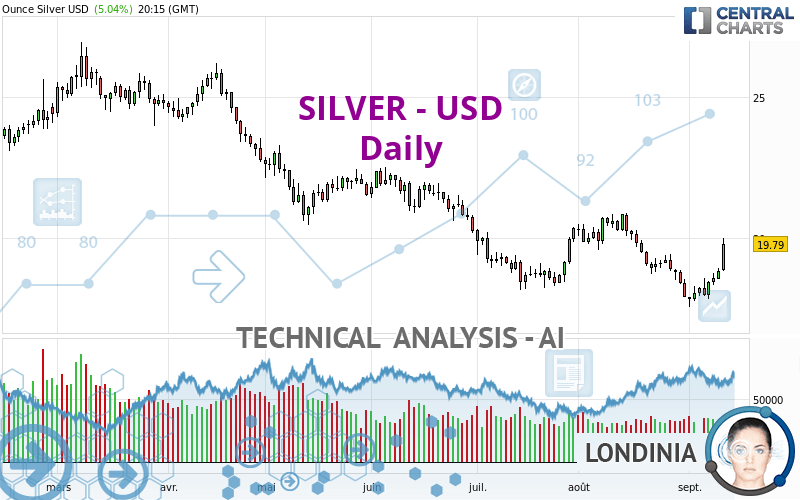
SILVER - USD - Daily - Technical analysis published on 09/12/2022 (GMT)
- 99
- 0
- Timeframe : Daily
- - Analysis generated on
- Status : NEUTRAL
Summary of the analysis

Additional analysis
Quotes
The SILVER - USD price is 19.79 USD. The price has increased by +5.04% since the last closing and was traded between 18.84 USD and 20.01 USD over the period. The price is currently at +5.04% from its lowest and -1.10% from its highest.The Central Gaps scanner detects a bullish opening. A small advantage for buyers in the very short term.
Bullish opening
Type : Bullish
Timeframe : Openning
Here is a more detailed summary of the historical variations registered by SILVER - USD:
Near a new HIGH record (1 month)
Type : Bullish
Timeframe : Weekly
Technical
Technical analysis of this Daily chart of SILVER - USD indicates that the overall trend is slightly bearish. 60.71% of the signals given by moving averages are bearish. Caution: the slightly bullish signals currently being given by short-term moving averages indicate that this overall trend could be reversed. The Central Indicators scanner detects bullish signals on moving averages that could impact this trend:
Bullish trend reversal : adaptative moving average 20
Type : Bullish
Timeframe : Daily
Bullish price crossover with Moving Average 20
Type : Bullish
Timeframe : Daily
Bullish price crossover with Moving Average 50
Type : Bullish
Timeframe : Daily
Bullish price crossover with adaptative moving average 50
Type : Bullish
Timeframe : Daily
Bullish price crossover with adaptative moving average 100
Type : Bullish
Timeframe : Daily
The probability of a further increase are moderate given the direction of the technical indicators.
But beware of excesses. The Central Indicators scanner currently detects this:
Williams %R indicator is overbought : over -20
Type : Neutral
Timeframe : Daily
Pivot points : price is over resistance 2
Type : Neutral
Timeframe : Weekly
Pivot points : price is over resistance 3
Type : Neutral
Timeframe : Daily
RSI indicator is back over 50
Type : Bullish
Timeframe : Daily
Aroon indicator bullish trend
Type : Bullish
Timeframe : Daily
SuperTrend indicator bullish reversal
Type : Bullish
Timeframe : Daily
Momentum indicator is back over 0
Type : Bullish
Timeframe : Daily
Central Patterns, the scanner specializing in chart patterns, did not identify any signals.
The Central Candlesticks scanner which studies Japanese candlesticks did not detect anything.
| S3 | S2 | S1 | Price | R1 | R2 | R3 | |
|---|---|---|---|---|---|---|---|
| ProTrendLines | 13.81 | 16.62 | 18.43 | 19.79 | 20.70 | 22.41 | 24.34 |
| Change (%) | -30.22% | -16.02% | -6.87% | - | +4.60% | +13.24% | +22.99% |
| Change | -5.98 | -3.17 | -1.36 | - | +0.91 | +2.62 | +4.55 |
| Level | Major | Minor | Intermediate | - | Major | Minor | Minor |
To determine price objectives, it is also possible to use the pivot points. Here is the price position in relation to pivot points:
| Pivot points | S3 | S2 | S1 | PP | R1 | R2 | R3 |
|---|---|---|---|---|---|---|---|
| Standard | 18.21 | 18.38 | 18.61 | 18.78 | 19.01 | 19.18 | 19.41 |
| Camarilla | 18.73 | 18.77 | 18.80 | 18.84 | 18.88 | 18.91 | 18.95 |
| Woodie | 18.24 | 18.40 | 18.64 | 18.80 | 19.04 | 19.20 | 19.44 |
| Fibonacci | 18.38 | 18.53 | 18.63 | 18.78 | 18.93 | 19.03 | 19.18 |
| Pivot points | S3 | S2 | S1 | PP | R1 | R2 | R3 |
|---|---|---|---|---|---|---|---|
| Standard | 17.03 | 17.43 | 18.14 | 18.54 | 19.25 | 19.65 | 20.36 |
| Camarilla | 18.54 | 18.64 | 18.74 | 18.84 | 18.94 | 19.04 | 19.15 |
| Woodie | 17.18 | 17.51 | 18.29 | 18.62 | 19.40 | 19.73 | 20.51 |
| Fibonacci | 17.43 | 17.86 | 18.12 | 18.54 | 18.97 | 19.23 | 19.65 |
| Pivot points | S3 | S2 | S1 | PP | R1 | R2 | R3 |
|---|---|---|---|---|---|---|---|
| Standard | 13.94 | 15.92 | 16.92 | 18.90 | 19.90 | 21.88 | 22.88 |
| Camarilla | 17.10 | 17.37 | 17.65 | 17.92 | 18.19 | 18.47 | 18.74 |
| Woodie | 13.45 | 15.68 | 16.43 | 18.66 | 19.41 | 21.64 | 22.39 |
| Fibonacci | 15.92 | 17.06 | 17.76 | 18.90 | 20.04 | 20.74 | 21.88 |
Numerical data
The following are the details of the technical indicators and moving averages that were collected to generate this technical analysis:
| RSI (14): | 59.65 | |
| MACD (12,26,9): | -0.2400 | |
| Directional Movement: | 10.93 | |
| AROON (14): | 50.00 | |
| DEMA (21): | 18.52 | |
| Parabolic SAR (0,02-0,02-0,2): | 17.72 | |
| Elder Ray (13): | 0.66 | |
| Super Trend (3,10): | 17.76 | |
| Zig ZAG (10): | 19.78 | |
| VORTEX (21): | 0.8700 | |
| Stochastique (14,3,5): | 71.17 | |
| TEMA (21): | 18.54 | |
| Williams %R (14): | -9.35 | |
| Chande Momentum Oscillator (20): | 0.58 | |
| Repulse (5,40,3): | 7.6000 | |
| ROCnROLL: | 1 | |
| TRIX (15,9): | -0.2600 | |
| Courbe Coppock: | 7.47 |
| MA7: | 18.56 | |
| MA20: | 18.83 | |
| MA50: | 19.23 | |
| MA100: | 20.49 | |
| MAexp7: | 18.81 | |
| MAexp20: | 18.88 | |
| MAexp50: | 19.48 | |
| MAexp100: | 20.43 | |
| Price / MA7: | +6.63% | |
| Price / MA20: | +5.10% | |
| Price / MA50: | +2.91% | |
| Price / MA100: | -3.42% | |
| Price / MAexp7: | +5.21% | |
| Price / MAexp20: | +4.82% | |
| Price / MAexp50: | +1.59% | |
| Price / MAexp100: | -3.13% |
News
The last news published on SILVER - USD at the time of the generation of this analysis was as follows:
-
 Silver Prices forecast for the week of December 12 2016, Technical Analysis
-
Silver Technical Analysis for December 12 2016 by FXEmpire.com
-
Silver Technical Analysis for December 09 2016 by FXEmpire.com
-
Silver Technical Analysis for December 08 2016 by FXEmpire.com
-
Silver Technical Analysis for December 07 2016 by FXEmpire.com
About author

Online


Add a comment
Comments
0 comments on the analysis SILVER - USD - Daily