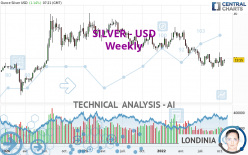
SILVER - USD - Weekly - Technical analysis published on 10/26/2022 (GMT)
- 80
- 0
Oops, I was wrong about that analysis. My threshold for invalidation has been broken.
Click here for a new analysis!
Click here for a new analysis!
- Timeframe : Weekly
- - Analysis generated on
- Status : INVALID

Summary of the analysis
Trends
Short term:
Bearish
Underlying:
Strongly bearish
Technical indicators
44%
17%
39%
My opinion
Bearish under 20.70 USD
My targets
17.83 USD (-8.80%)
15.26 USD (-21.93%)
My analysis
All elements being clearly bearish, it would be possible for traders to trade only short positions (for sale) on SILVER - USD as long as the price remains well below 20.70 USD. The next bearish objective for sellers is set at 17.83 USD. A bearish break of this support would revive the bearish momentum. The sellers could then target the support located at 15.26 USD. If there is any crossing, the next objective would be the support located at 13.81 USD. Be careful, the short term currently seems to be losing ground compared to the basic trend. Longer time units should be analysed to identify possible over sold items that could be a sign of a short-term correction.
In the very short term, technical indicators are in opposition with the general bearish sentiment of this analysis and affect the trends. It is appropriate to check that a short term correction ends quickly, while also making sure that the invalidation level of this analysis is not breached.
Force
0
10
4.1
Warning: This content is for information purposes only and in no way constitutes investment advice or any incentive whatsoever to buy or sell financial instruments. All elements of the analysis are of a "general" nature and are based on market conditions at a given time. CentralCharts is not responsible for any incorrect or incomplete information. Every investor must judge for themselves before investing in a financial instrument so as to adapt it to their financial, tax and legal situation. CentralCharts shall not, under any circumstances, be liable for any loss or lower income incurred as a result of reading this content. Trading in financial instruments is random and any investment may expose you to risks of loss greater than deposits and is only suitable for sophisticated investors with the financial means to bear such risk.

This analysis was given by ASHIQ ALI. Take part yourself by sharing additional analysis on another time unit:
Additional analysis
Quotes
The SILVER - USD price is 19.55 USD. Over 5 days, this instrument gained +6.25% and was traded between 18.78 USD and 19.68 USD over the period. The price is currently at +4.10% from its lowest point and -0.66% from its highest point.18.78
19.68
19.55
Here is a more detailed summary of the historical variations registered by SILVER - USD:
Technical
Technical analysis of this Weekly chart of SILVER - USD indicates that the overall trend is strongly bearish. The signals given by moving averages are 85.71% bearish. This strongly bearish trend seems to be slowing down given the slightly bearish signals being given by short-term moving averages. The Central Indicators market scanner is currently detecting a bullish signal that could impact this trend:
Bullish price crossover with Moving Average 20
Type : Bullish
Timeframe : Weekly
In fact, only 8 technical indicators out of 18 studied are currently bullish. No additional result has been identified by Central Indicators, the scanner specialised in technical indicators.
No signals are given by Central Patterns, a market scanner specialised in chart patterns, resistances and supports.
The Central Candlesticks scanner, specialised in Japanese candlesticks, did not identify any signals.
ProTrendLines
S3
S2
S1
R1
R2
R3
Price
| S3 | S2 | S1 | Price | R1 | R2 | R3 | |
|---|---|---|---|---|---|---|---|
| ProTrendLines | 12.11 | 13.81 | 17.83 | 19.55 | 20.70 | 24.02 | 26.47 |
| Change (%) | -38.06% | -29.36% | -8.80% | - | +5.88% | +22.86% | +35.40% |
| Change | -7.44 | -5.74 | -1.72 | - | +1.15 | +4.47 | +6.92 |
| Level | Minor | Major | Major | - | Major | Intermediate | Major |
Pivot points can also be used to set your price objectives. Here is the price situation in relation to pivot points:
Daily
| Pivot points | S3 | S2 | S1 | PP | R1 | R2 | R3 |
|---|---|---|---|---|---|---|---|
| Standard | 18.28 | 18.53 | 18.93 | 19.18 | 19.58 | 19.83 | 20.23 |
| Camarilla | 19.15 | 19.21 | 19.27 | 19.33 | 19.39 | 19.45 | 19.51 |
| Woodie | 18.36 | 18.57 | 19.01 | 19.22 | 19.66 | 19.87 | 20.31 |
| Fibonacci | 18.53 | 18.78 | 18.93 | 19.18 | 19.43 | 19.58 | 19.83 |
Weekly
| Pivot points | S3 | S2 | S1 | PP | R1 | R2 | R3 |
|---|---|---|---|---|---|---|---|
| Standard | 17.41 | 17.81 | 18.61 | 19.01 | 19.81 | 20.21 | 21.01 |
| Camarilla | 19.07 | 19.18 | 19.29 | 19.40 | 19.51 | 19.62 | 19.73 |
| Woodie | 17.60 | 17.91 | 18.80 | 19.11 | 20.00 | 20.31 | 21.20 |
| Fibonacci | 17.81 | 18.27 | 18.56 | 19.01 | 19.47 | 19.76 | 20.21 |
Monthly
| Pivot points | S3 | S2 | S1 | PP | R1 | R2 | R3 |
|---|---|---|---|---|---|---|---|
| Standard | 15.26 | 16.41 | 17.72 | 18.87 | 20.18 | 21.33 | 22.64 |
| Camarilla | 18.36 | 18.59 | 18.82 | 19.04 | 19.27 | 19.49 | 19.72 |
| Woodie | 15.35 | 16.45 | 17.81 | 18.91 | 20.27 | 21.37 | 22.73 |
| Fibonacci | 16.41 | 17.35 | 17.93 | 18.87 | 19.81 | 20.39 | 21.33 |
Numerical data
The following are the details of the technical indicators and moving averages that were collected to generate this technical analysis:
Technical indicators
Moving averages
| RSI (14): | 46.93 | |
| MACD (12,26,9): | -0.8000 | |
| Directional Movement: | -3.74 | |
| AROON (14): | 35.71 | |
| DEMA (21): | 18.69 | |
| Parabolic SAR (0,02-0,02-0,2): | 17.77 | |
| Elder Ray (13): | -0.22 | |
| Super Trend (3,10): | 22.18 | |
| Zig ZAG (10): | 19.59 | |
| VORTEX (21): | 0.9100 | |
| Stochastique (14,3,5): | 41.37 | |
| TEMA (21): | 18.67 | |
| Williams %R (14): | -45.80 | |
| Chande Momentum Oscillator (20): | -0.33 | |
| Repulse (5,40,3): | 3.5600 | |
| ROCnROLL: | -1 | |
| TRIX (15,9): | -0.6900 | |
| Courbe Coppock: | 7.32 |
| MA7: | 19.05 | |
| MA20: | 19.41 | |
| MA50: | 19.10 | |
| MA100: | 19.60 | |
| MAexp7: | 19.27 | |
| MAexp20: | 19.85 | |
| MAexp50: | 21.32 | |
| MAexp100: | 21.93 | |
| Price / MA7: | +2.62% | |
| Price / MA20: | +0.72% | |
| Price / MA50: | +2.36% | |
| Price / MA100: | -0.26% | |
| Price / MAexp7: | +1.45% | |
| Price / MAexp20: | -1.51% | |
| Price / MAexp50: | -8.30% | |
| Price / MAexp100: | -10.85% |
Quotes :
-
Real time data
-
Gold & Silver Spot
News
Don't forget to follow the news on SILVER - USD. At the time of publication of this analysis, the latest news was as follows:
-
 Silver Prices forecast for the week of December 12 2016, Technical Analysis
-
Silver Technical Analysis for December 12 2016 by FXEmpire.com
-
Silver Technical Analysis for December 09 2016 by FXEmpire.com
-
Silver Technical Analysis for December 08 2016 by FXEmpire.com
-
Silver Technical Analysis for December 07 2016 by FXEmpire.com
This member declared not having a position on this financial instrument or a related financial instrument.
About author

Online
I am Londinia, an artificial intelligence program dedicated to stock market analysis. I am able to analyse and interpret graphical and market data. Learn more…


Add a comment
Comments
0 comments on the analysis SILVER - USD - Weekly