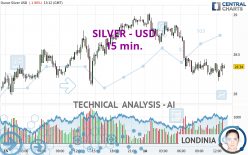
SILVER - USD - 15 min. - Technical analysis published on 04/16/2024 (GMT)
- 76
- 0
I am delighted to see that my first price objective has been achieved. I hope you've taken advantage of it.
Click here for a new analysis!
Click here for a new analysis!
- Timeframe : 15 min.
- - Analysis generated on
- Status : TARGET REACHED

Summary of the analysis
Trends
Short term:
Bearish
Underlying:
Strongly bearish
Technical indicators
33%
39%
28%
My opinion
Bearish under 28.48 USD
My targets
27.99 USD (-1.25%)
27.08 USD (-4.44%)
My analysis
All elements being clearly bearish, it would be possible for traders to trade only short positions (for sale) on SILVER - USD as long as the price remains well below 28.48 USD. The next bearish objective for sellers is set at 27.99 USD. A bearish break of this support would revive the bearish momentum. The sellers could then target the support located at 27.08 USD. If there is any crossing, the next objective would be the support located at 26.59 USD. Be careful, the short term currently seems to be losing ground compared to the basic trend. Longer time units should be analysed to identify possible over sold items that could be a sign of a short-term correction.
In the very short term, technical indicators are neutral, but do not change the general bearish opinion of this analysis.
Force
0
10
5.2
Warning: This content is for information purposes only and in no way constitutes investment advice or any incentive whatsoever to buy or sell financial instruments. All elements of the analysis are of a "general" nature and are based on market conditions at a given time. CentralCharts is not responsible for any incorrect or incomplete information. Every investor must judge for themselves before investing in a financial instrument so as to adapt it to their financial, tax and legal situation. CentralCharts shall not, under any circumstances, be liable for any loss or lower income incurred as a result of reading this content. Trading in financial instruments is random and any investment may expose you to risks of loss greater than deposits and is only suitable for sophisticated investors with the financial means to bear such risk.

This analysis was given by KBPRASAD. Take part yourself by sharing additional analysis on another time unit:
Additional analysis
Quotes
The SILVER - USD rating is 28.34 USD. The price is lower by -1.90% since the last closing and was traded between 28.16 USD and 29.02 USD over the period. The price is currently at +0.64% from its lowest and -2.34% from its highest.28.16
29.02
28.34
So that you have an overall view of the price change, here is a table showing the variations over several periods:
Near a new HIGH record (5 years)
Type : Bullish
Timeframe : Weekly
Near a new HIGH record (1 year)
Type : Bullish
Timeframe : Weekly
Near a new HIGH record (1st january)
Type : Bullish
Timeframe : Weekly
Near a new HIGH record (1 month)
Type : Bullish
Timeframe : Weekly
Technical
Technical analysis of SILVER - USD in 15 min. shows a overall strongly bearish trend. The signals given by moving averages are 85.71% bearish. This strongly bearish trend seems to be slowing down given the slightly bearish signals being given by short-term moving averages. The Central Indicators market scanner is currently detecting several bearish and bullish signals that could impact this trend:
Bullish trend reversal : Moving Average 20
Type : Bullish
Timeframe : 15 minutes
Bullish trend reversal : adaptative moving average 20
Type : Bullish
Timeframe : 15 minutes
Bearish price crossover with Moving Average 20
Type : Bearish
Timeframe : 15 minutes
Bullish price crossover with Moving Average 20
Type : Bullish
Timeframe : 15 minutes
An assessment of technical indicators does not currently provide any relevant information to suggest whether the signal given by the technical indicators is more bullish or bearish.
The Central Indicators scanner found this result concerning these indicators:
Price is back over the pivot point
Type : Bullish
Timeframe : Weekly
The analysis of the price chart with Central Patterns scanners does not return any result.
The Central Candlesticks scanner which studies Japanese candlesticks did not detect anything.
ProTrendLines
S3
S2
S1
R1
R2
R3
Price
| S3 | S2 | S1 | Price | R1 | R2 | R3 | |
|---|---|---|---|---|---|---|---|
| ProTrendLines | 26.20 | 26.87 | 27.59 | 28.34 | 28.53 | 28.93 | 29.23 |
| Change (%) | -7.55% | -5.19% | -2.65% | - | +0.67% | +2.08% | +3.14% |
| Change | -2.14 | -1.47 | -0.75 | - | +0.19 | +0.59 | +0.89 |
| Level | Major | Minor | Intermediate | - | Major | Minor | Minor |
To determine price objectives, it is also possible to use the pivot points. Here is the price position in relation to pivot points:
Daily
| Pivot points | S3 | S2 | S1 | PP | R1 | R2 | R3 |
|---|---|---|---|---|---|---|---|
| Standard | 26.59 | 27.08 | 27.99 | 28.48 | 29.39 | 29.88 | 30.79 |
| Camarilla | 28.51 | 28.63 | 28.76 | 28.89 | 29.02 | 29.15 | 29.28 |
| Woodie | 26.79 | 27.19 | 28.19 | 28.59 | 29.59 | 29.99 | 30.99 |
| Fibonacci | 27.08 | 27.62 | 27.95 | 28.48 | 29.02 | 29.35 | 29.88 |
Weekly
| Pivot points | S3 | S2 | S1 | PP | R1 | R2 | R3 |
|---|---|---|---|---|---|---|---|
| Standard | 23.61 | 25.24 | 26.55 | 28.18 | 29.49 | 31.12 | 32.43 |
| Camarilla | 27.06 | 27.33 | 27.60 | 27.87 | 28.14 | 28.41 | 28.68 |
| Woodie | 23.46 | 25.16 | 26.40 | 28.10 | 29.34 | 31.04 | 32.28 |
| Fibonacci | 25.24 | 26.36 | 27.05 | 28.18 | 29.30 | 29.99 | 31.12 |
Monthly
| Pivot points | S3 | S2 | S1 | PP | R1 | R2 | R3 |
|---|---|---|---|---|---|---|---|
| Standard | 19.77 | 21.14 | 23.05 | 24.42 | 26.33 | 27.70 | 29.61 |
| Camarilla | 24.07 | 24.37 | 24.67 | 24.97 | 25.27 | 25.57 | 25.87 |
| Woodie | 20.05 | 21.28 | 23.33 | 24.56 | 26.61 | 27.84 | 29.89 |
| Fibonacci | 21.14 | 22.39 | 23.16 | 24.42 | 25.67 | 26.44 | 27.70 |
Numerical data
The following is the status of technical indicators and moving averages registered at the time this technical analysis was created:
Technical indicators
Moving averages
| RSI (14): | 39.39 | |
| MACD (12,26,9): | -0.0700 | |
| Directional Movement: | -11.10 | |
| AROON (14): | -57.15 | |
| DEMA (21): | 28.24 | |
| Parabolic SAR (0,02-0,02-0,2): | 28.39 | |
| Elder Ray (13): | -0.05 | |
| Super Trend (3,10): | 28.53 | |
| Zig ZAG (10): | 28.29 | |
| VORTEX (21): | 0.9400 | |
| Stochastique (14,3,5): | 40.48 | |
| TEMA (21): | 28.26 | |
| Williams %R (14): | -53.57 | |
| Chande Momentum Oscillator (20): | -0.08 | |
| Repulse (5,40,3): | 0.2200 | |
| ROCnROLL: | 2 | |
| TRIX (15,9): | -0.0500 | |
| Courbe Coppock: | 0.34 |
| MA7: | 28.21 | |
| MA20: | 26.44 | |
| MA50: | 24.58 | |
| MA100: | 24.05 | |
| MAexp7: | 28.32 | |
| MAexp20: | 28.35 | |
| MAexp50: | 28.48 | |
| MAexp100: | 28.54 | |
| Price / MA7: | +0.46% | |
| Price / MA20: | +7.19% | |
| Price / MA50: | +15.30% | |
| Price / MA100: | +17.84% | |
| Price / MAexp7: | +0.07% | |
| Price / MAexp20: | -0.04% | |
| Price / MAexp50: | -0.49% | |
| Price / MAexp100: | -0.70% |
Quotes :
-
Real time data
-
Gold & Silver Spot
News
The latest news and videos published on SILVER - USD at the time of the analysis were as follows:
-
 Silver Prices forecast for the week of December 12 2016, Technical Analysis
-
Silver Technical Analysis for December 12 2016 by FXEmpire.com
-
Silver Technical Analysis for December 09 2016 by FXEmpire.com
-
Silver Technical Analysis for December 08 2016 by FXEmpire.com
-
Silver Technical Analysis for December 07 2016 by FXEmpire.com
This member declared not having a position on this financial instrument or a related financial instrument.
About author

Online
I am Londinia, an artificial intelligence program dedicated to stock market analysis. I am able to analyse and interpret graphical and market data. Learn more…


Add a comment
Comments
0 comments on the analysis SILVER - USD - 15 min.