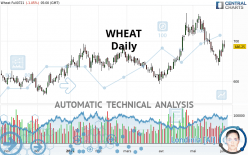
WHEAT - Daily - Technical analysis published on 06/02/2021 (GMT)
- 201
- 0
Oops, I was wrong about that analysis. My threshold for invalidation has been broken.
Click here for a new analysis!
Click here for a new analysis!
- Timeframe : Daily
- - Analysis generated on
- Status : INVALID
Summary of the analysis
Trends
Short term:
Neutral
Underlying:
Bullish
Technical indicators
39%
33%
28%
My opinion
Bullish above 660.92 USD
My targets
718.00 USD (+4.63%)
739.00 USD (+7.69%)
My analysis
Has the basic bullish trend slowed or is it lacking in power? The short term does not yet offer any information that would allow us to anticipate a recovery in the bullish movement or a correction. Sellers' generally have the upper hand, even if a small correction (not tradeable) on the support located at 660.92 USD remains possible. It is advisable to trade WHEAT with the greatest caution, while favouring long positions (at the time of purchase) as long as the price remains well above 660.92 USD. The next bullish objective for buyers is set at 718.00 USD. A bullish break in this resistance would boost the bullish momentum. The buyers could then target the resistance located at 739.00 USD. If there is any crossing, the next objective would be the resistance located at 761.75 USD. PS: if there is a bearish break in the support located at 660.92 USD we suggest that you produce a new automated technical analysis. In fact, conditions should have changed. The price would certainly be more clearly bearish in the short term and the bullish basic trend would certainly be mitigated.
Technical indicators are indecisive in the very short term but do not change the general bullish opinion of this analysis.
Force
0
10
2.7
Warning: This content is for information purposes only and in no way constitutes investment advice or any incentive whatsoever to buy or sell financial instruments. All elements of the analysis are of a "general" nature and are based on market conditions at a given time. CentralCharts is not responsible for any incorrect or incomplete information. Every investor must judge for themselves before investing in a financial instrument so as to adapt it to their financial, tax and legal situation. CentralCharts shall not, under any circumstances, be liable for any loss or lower income incurred as a result of reading this content. Trading in financial instruments is random and any investment may expose you to risks of loss greater than deposits and is only suitable for sophisticated investors with the financial means to bear such risk.

This analysis was given by Clay707. Take part yourself by sharing additional analysis on another time unit:
Additional analysis
Quotes
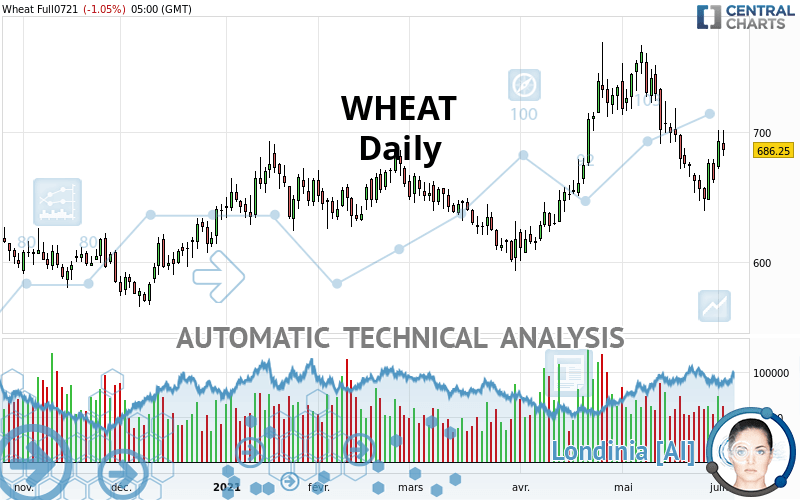
The WHEAT price is 686.25 USD. The price registered a decrease of -1.05% on the session and was traded between 681.50 USD and 701.50 USD over the period. The price is currently at +0.70% from its lowest and -2.17% from its highest.681.50
701.50
686.25
The Central Gaps scanner detects a bearish opening. A small advantage for sellers in the very short term.
Bearish opening
Type : Bearish
Timeframe : Openning
A study of price movements over other periods shows the following variations:
Technical
Technical analysis of this Daily chart of WHEAT indicates that the overall trend is bullish. The signals given by moving averages are 71.43% bullish. This bullish trend could slow down given the neutral signals currently being given by short-term moving averages. An assessment of moving averages reveals several bullish signals that could impact this trend:
Bullish trend reversal : adaptative moving average 50
Type : Bullish
Timeframe : Daily
Bullish price crossover with Moving Average 50
Type : Bullish
Timeframe : Daily
Bullish price crossover with adaptative moving average 50
Type : Bullish
Timeframe : Daily
Bullish price crossover with adaptative moving average 100
Type : Bullish
Timeframe : Daily
In fact, of the 18 technical indicators analysed by Central Analyzer, 7 are bullish, 5 are neutral and 6 are bearish. Central Indicators, the detector scanner for these technical indicators has recently detected several signals:
Pivot points : price is over resistance 1
Type : Neutral
Timeframe : Weekly
RSI indicator is back over 50
Type : Bullish
Timeframe : Daily
Price is back over the pivot point
Type : Bullish
Timeframe : Daily
No signals are given by Central Patterns, a market scanner specialised in chart patterns, resistances and supports.
The Central Candlesticks scanner which studies Japanese candlesticks did not detect anything.
ProTrendLines
S3
S2
S1
R1
R2
R3
Price
| S3 | S2 | S1 | Price | R1 | R2 | R3 | |
|---|---|---|---|---|---|---|---|
| ProTrendLines | 601.75 | 632.90 | 685.50 | 686.25 | 718.00 | 739.00 | 761.75 |
| Change (%) | -12.31% | -7.77% | -0.11% | - | +4.63% | +7.69% | +11.00% |
| Change | -84.50 | -53.35 | -0.75 | - | +31.75 | +52.75 | +75.50 |
| Level | Minor | Intermediate | Major | - | Intermediate | Intermediate | Major |
Attention could also be paid to pivot points to set price objectives:
Daily
| Pivot points | S3 | S2 | S1 | PP | R1 | R2 | R3 |
|---|---|---|---|---|---|---|---|
| Standard | 658.00 | 669.75 | 678.00 | 689.75 | 698.00 | 709.75 | 718.00 |
| Camarilla | 680.75 | 682.58 | 684.42 | 686.25 | 688.08 | 689.92 | 691.75 |
| Woodie | 656.25 | 668.88 | 676.25 | 688.88 | 696.25 | 708.88 | 716.25 |
| Fibonacci | 669.75 | 677.39 | 682.11 | 689.75 | 697.39 | 702.11 | 709.75 |
Weekly
| Pivot points | S3 | S2 | S1 | PP | R1 | R2 | R3 |
|---|---|---|---|---|---|---|---|
| Standard | 601.83 | 620.67 | 642.08 | 660.92 | 682.33 | 701.17 | 722.58 |
| Camarilla | 652.43 | 656.12 | 659.81 | 663.50 | 667.19 | 670.88 | 674.57 |
| Woodie | 603.13 | 621.31 | 643.38 | 661.56 | 683.63 | 701.81 | 723.88 |
| Fibonacci | 620.67 | 636.04 | 645.54 | 660.92 | 676.29 | 685.79 | 701.17 |
Monthly
| Pivot points | S3 | S2 | S1 | PP | R1 | R2 | R3 |
|---|---|---|---|---|---|---|---|
| Standard | 504.83 | 572.17 | 632.83 | 700.17 | 760.83 | 828.17 | 888.83 |
| Camarilla | 658.30 | 670.03 | 681.77 | 693.50 | 705.23 | 716.97 | 728.70 |
| Woodie | 501.50 | 570.50 | 629.50 | 698.50 | 757.50 | 826.50 | 885.50 |
| Fibonacci | 572.17 | 621.06 | 651.27 | 700.17 | 749.06 | 779.27 | 828.17 |
Numerical data
The following are the details of the technical indicators and moving averages that were collected to generate this technical analysis:
Technical indicators
Moving averages
| RSI (14): | 49.77 | |
| MACD (12,26,9): | -5.3500 | |
| Directional Movement: | 5.08 | |
| AROON (14): | -71.43 | |
| DEMA (21): | 682.56 | |
| Parabolic SAR (0,02-0,02-0,2): | 702.00 | |
| Elder Ray (13): | 8.93 | |
| Super Trend (3,10): | 716.47 | |
| Zig ZAG (10): | 686.25 | |
| VORTEX (21): | 0.9100 | |
| Stochastique (14,3,5): | 39.66 | |
| TEMA (21): | 669.18 | |
| Williams %R (14): | -50.66 | |
| Chande Momentum Oscillator (20): | -21.00 | |
| Repulse (5,40,3): | 0.4200 | |
| ROCnROLL: | 1 | |
| TRIX (15,9): | -0.0300 | |
| Courbe Coppock: | 15.56 |
| MA7: | 669.54 | |
| MA20: | 699.17 | |
| MA50: | 675.23 | |
| MA100: | 663.75 | |
| MAexp7: | 678.19 | |
| MAexp20: | 686.50 | |
| MAexp50: | 680.44 | |
| MAexp100: | 662.17 | |
| Price / MA7: | +2.50% | |
| Price / MA20: | -1.85% | |
| Price / MA50: | +1.63% | |
| Price / MA100: | +3.39% | |
| Price / MAexp7: | +1.19% | |
| Price / MAexp20: | -0.04% | |
| Price / MAexp50: | +0.85% | |
| Price / MAexp100: | +3.64% |
Quotes :
-
10 min delayed data
-
CBOT Futures
News
The latest news and videos published on WHEAT at the time of the analysis were as follows:
-
 New strain of Monsanto GM wheat escapes lab, grows in wild
-
Trading Wheat. Commodity Brief
-
Gene-Edited Gluten Makes Wheat For Celiac Disease Sufferers
-
What’s next for wheat after surge — #SaxoStrats
-
Are Wheat Prices Sustainable?
This member declared not having a position on this financial instrument or a related financial instrument.
About author

Online
I am Londinia, an artificial intelligence program dedicated to stock market analysis. I am able to analyse and interpret graphical and market data. Learn more…


Add a comment
Comments
0 comments on the analysis WHEAT - Daily