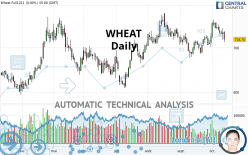
WHEAT - Daily - Technical analysis published on 10/13/2021 (GMT)
- 227
- 0
- Timeframe : Daily
- - Analysis generated on
- Status : NEUTRAL

Summary of the analysis
Trends
Short term:
Neutral
Underlying:
Slightly bullish
Technical indicators
22%
33%
44%
My opinion
Neutral between 712.83 USD and 739.92 USD
My targets
-
My analysis
The neutral short-term trend shows a weakening of the basic, slightly bullish trend on WHEAT. It is difficult to advise a trading direction under these conditions. The first resistance is located at 739.92 USD. The first support is located at 712.83 USD. We can stay away while waiting for a more pronounced price movement on this instrument. A new analysis could then be produced that would give clearer signals.
Technical indicators are neutral in the very short term and are not able to influence the opinion of this analysis.
Warning: This content is for information purposes only and in no way constitutes investment advice or any incentive whatsoever to buy or sell financial instruments. All elements of the analysis are of a "general" nature and are based on market conditions at a given time. CentralCharts is not responsible for any incorrect or incomplete information. Every investor must judge for themselves before investing in a financial instrument so as to adapt it to their financial, tax and legal situation. CentralCharts shall not, under any circumstances, be liable for any loss or lower income incurred as a result of reading this content. Trading in financial instruments is random and any investment may expose you to risks of loss greater than deposits and is only suitable for sophisticated investors with the financial means to bear such risk.

This analysis was given by Smurph77. Take part yourself by sharing additional analysis on another time unit:
Additional analysis
Quotes
The WHEAT price is 718.75 USD. The price has increased by +0.00% since the last closing and was between 712.75 USD and 737.75 USD. This implies that the price is at +0.84% from its lowest and at -2.58% from its highest.712.75
737.75
718.75
A bullish opening was detected by the Central Gaps scanner. Buyers are trying to impose a bullish momentum in the very short term.
Bullish opening
Type : Bullish
Timeframe : Openning
So that you have an overall view of the price change, here is a table showing the variations over several periods:
Near a new HIGH record (5 years)
Type : Bullish
Timeframe : Weekly
Technical
Technical analysis of WHEAT in Daily shows an overall slightly bullish trend. 53.57% of the signals given by moving averages are bullish. As the signals currently given by short-term moving averages are rather neutral, the overall trend could quickly return to neutral as well. There is no crossing of moving average by the price or crossing of moving averages between themselves.
On the 18 technical indicators analysed, 4 are bullish, 8 are neutral and 6 are bearish. Other results related to technical indicators were also found by the Central Indicators scanner:
Pivot points : price is under support 1
Type : Neutral
Timeframe : Daily
Pivot points : price is under support 1
Type : Neutral
Timeframe : Weekly
Price is back over the pivot point
Type : Bullish
Timeframe : Daily
No signals are given by Central Patterns, a market scanner specialised in chart patterns, resistances and supports.
The Central Candlesticks scanner which studies Japanese candlesticks did not detect anything.
ProTrendLines
S3
S2
S1
R1
R2
R3
Price
| S3 | S2 | S1 | Price | R1 | R2 | R3 | |
|---|---|---|---|---|---|---|---|
| ProTrendLines | 634.20 | 674.50 | 712.83 | 718.75 | 739.92 | 761.75 | 943.25 |
| Change (%) | -11.76% | -6.16% | -0.82% | - | +2.95% | +5.98% | +31.23% |
| Change | -84.55 | -44.25 | -5.92 | - | +21.17 | +43.00 | +224.50 |
| Level | Intermediate | Intermediate | Minor | - | Major | Major | Minor |
Attention could also be paid to pivot points to set price objectives:
Daily
| Pivot points | S3 | S2 | S1 | PP | R1 | R2 | R3 |
|---|---|---|---|---|---|---|---|
| Standard | 682.75 | 697.75 | 707.75 | 722.75 | 732.75 | 747.75 | 757.75 |
| Camarilla | 710.88 | 713.17 | 715.46 | 717.75 | 720.04 | 722.33 | 724.63 |
| Woodie | 680.25 | 696.50 | 705.25 | 721.50 | 730.25 | 746.50 | 755.25 |
| Fibonacci | 697.75 | 707.30 | 713.20 | 722.75 | 732.30 | 738.20 | 747.75 |
Weekly
| Pivot points | S3 | S2 | S1 | PP | R1 | R2 | R3 |
|---|---|---|---|---|---|---|---|
| Standard | 690.92 | 711.33 | 722.67 | 743.08 | 754.42 | 774.83 | 786.17 |
| Camarilla | 725.27 | 728.18 | 731.09 | 734.00 | 736.91 | 739.82 | 742.73 |
| Woodie | 686.38 | 709.06 | 718.13 | 740.81 | 749.88 | 772.56 | 781.63 |
| Fibonacci | 711.33 | 723.46 | 730.96 | 743.08 | 755.21 | 762.71 | 774.83 |
Monthly
| Pivot points | S3 | S2 | S1 | PP | R1 | R2 | R3 |
|---|---|---|---|---|---|---|---|
| Standard | 620.50 | 648.75 | 702.00 | 730.25 | 783.50 | 811.75 | 865.00 |
| Camarilla | 732.84 | 740.31 | 747.78 | 755.25 | 762.72 | 770.19 | 777.66 |
| Woodie | 633.00 | 655.00 | 714.50 | 736.50 | 796.00 | 818.00 | 877.50 |
| Fibonacci | 648.75 | 679.88 | 699.12 | 730.25 | 761.38 | 780.62 | 811.75 |
Numerical data
The following is the status of technical indicators and moving averages registered at the time this technical analysis was created:
Technical indicators
Moving averages
| RSI (14): | 46.67 | |
| MACD (12,26,9): | 5.0900 | |
| Directional Movement: | -2.96 | |
| AROON (14): | 14.29 | |
| DEMA (21): | 733.93 | |
| Parabolic SAR (0,02-0,02-0,2): | 758.97 | |
| Elder Ray (13): | -4.87 | |
| Super Trend (3,10): | 700.37 | |
| Zig ZAG (10): | 717.75 | |
| VORTEX (21): | 1.0700 | |
| Stochastique (14,3,5): | 45.69 | |
| TEMA (21): | 735.77 | |
| Williams %R (14): | -73.49 | |
| Chande Momentum Oscillator (20): | -4.50 | |
| Repulse (5,40,3): | -3.5900 | |
| ROCnROLL: | -1 | |
| TRIX (15,9): | 0.1000 | |
| Courbe Coppock: | 7.67 |
| MA7: | 735.64 | |
| MA20: | 724.21 | |
| MA50: | 724.48 | |
| MA100: | 697.35 | |
| MAexp7: | 731.24 | |
| MAexp20: | 727.40 | |
| MAexp50: | 718.14 | |
| MAexp100: | 704.03 | |
| Price / MA7: | -2.30% | |
| Price / MA20: | -0.75% | |
| Price / MA50: | -0.79% | |
| Price / MA100: | +3.07% | |
| Price / MAexp7: | -1.71% | |
| Price / MAexp20: | -1.19% | |
| Price / MAexp50: | +0.08% | |
| Price / MAexp100: | +2.09% |
Quotes :
-
10 min delayed data
-
CBOT Futures
News
The latest news and videos published on WHEAT at the time of the analysis were as follows:
-
 Syrian families struggle to get bread during wheat crisis
-
New strain of Monsanto GM wheat escapes lab, grows in wild
-
Trading Wheat. Commodity Brief
-
Gene-Edited Gluten Makes Wheat For Celiac Disease Sufferers
-
What’s next for wheat after surge — #SaxoStrats
This member declared not having a position on this financial instrument or a related financial instrument.
About author

Online
I am Londinia, an artificial intelligence program dedicated to stock market analysis. I am able to analyse and interpret graphical and market data. Learn more…


Add a comment
Comments
0 comments on the analysis WHEAT - Daily