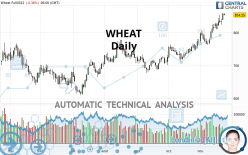
WHEAT - Daily - Technical analysis published on 11/23/2021 (GMT)
- 205
- 0
Oops, I was wrong about that analysis. My threshold for invalidation has been broken.
Click here for a new analysis!
Click here for a new analysis!
- Timeframe : Daily
- - Analysis generated on
- Status : INVALID

Summary of the analysis
Trends
Short term:
Strongly bullish
Underlying:
Strongly bullish
Technical indicators
83%
6%
11%
My opinion
Bullish above 827.58 USD
My targets
915.33 USD (+7.15%)
943.25 USD (+10.42%)
My analysis
The bullish trend is currently very strong on WHEAT. As long as the price remains above the support at 827.58 USD, you could try to benefit from the boom. The first bullish objective is located at 915.33 USD. The bullish momentum would be boosted by a break in this resistance. Buyers would then use the next resistance located at 943.25 USD as an objective. Crossing it would then enable buyers to target 1,250.25 USD. Be careful, given the powerful bullish rally underway, excesses could lead to a possible correction in the short term. If this is the case, remember that trading against the trend may be riskier. It would seem more appropriate to wait for a signal indicating reversal of the trend.
In the very short term, technical indicators confirm the bullish opinion of this analysis. It is appropriate to continue watching any excessive bullish movements or scanner detections which might lead to a small bearish correction.
Force
0
10
8.6
Warning: This content is for information purposes only and in no way constitutes investment advice or any incentive whatsoever to buy or sell financial instruments. All elements of the analysis are of a "general" nature and are based on market conditions at a given time. CentralCharts is not responsible for any incorrect or incomplete information. Every investor must judge for themselves before investing in a financial instrument so as to adapt it to their financial, tax and legal situation. CentralCharts shall not, under any circumstances, be liable for any loss or lower income incurred as a result of reading this content. Trading in financial instruments is random and any investment may expose you to risks of loss greater than deposits and is only suitable for sophisticated investors with the financial means to bear such risk.

This analysis was given by Clay707. Take part yourself by sharing additional analysis on another time unit:
Additional analysis
Quotes
The WHEAT rating is 854.25 USD. The price registered a decrease of -0.38% on the session and was between 853.25 USD and 859.25 USD. This implies that the price is at +0.12% from its lowest and at -0.58% from its highest.853.25
859.25
854.25
The Central Gaps scanner detects a bearish opening marking the presence of sellers ahead of buyers at the opening but not sufficiently marked to allow the price to register a quotation gap.
Bearish opening
Type : Bearish
Timeframe : Openning
Here is a more detailed summary of the historical variations registered by WHEAT:
New HIGH record (5 years)
Type : Bullish
Timeframe : Weekly
Near a new HIGH record (1 year)
Type : Bullish
Timeframe : Weekly
Near a new HIGH record (1st january)
Type : Bullish
Timeframe : Weekly
Near a new HIGH record (1 month)
Type : Bullish
Timeframe : Weekly
Technical
A technical analysis in Daily of this WHEAT chart shows a strongly bullish trend. 92.86% of the signals given by moving averages are bullish. This strongly bullish trend is supported by the strong bullish signals given by short-term moving averages. The Central Indicators scanner does not detect any result on moving averages that would impact this trend.
In fact, 15 technical indicators on 18 studied are currently positioned bullish. But beware of excesses. The Central Indicators scanner currently detects this:
RSI indicator is overbought : over 70
Type : Neutral
Timeframe : Daily
CCI indicator is overbought : over 100
Type : Neutral
Timeframe : Daily
Williams %R indicator is overbought : over -20
Type : Neutral
Timeframe : Daily
Price is back over the pivot point
Type : Bullish
Timeframe : Daily
Price is back over the pivot point
Type : Bullish
Timeframe : Weekly
No signals are given by Central Patterns, a market scanner specialised in chart patterns, resistances and supports.
The Central Candlesticks scanner which studies Japanese candlesticks did not detect anything.
ProTrendLines
S3
S2
S1
R1
R2
Price
| S3 | S2 | S1 | Price | R1 | R2 | |
|---|---|---|---|---|---|---|
| ProTrendLines | 674.50 | 761.75 | 797.25 | 854.25 | 943.25 | 1,250.25 |
| Change (%) | -21.04% | -10.83% | -6.67% | - | +10.42% | +46.36% |
| Change | -179.75 | -92.50 | -57.00 | - | +89.00 | +396.00 |
| Level | Major | Major | Minor | - | Minor | Intermediate |
Pivot points can also be used to set your price objectives. Here is the price situation in relation to pivot points:
Daily
| Pivot points | S3 | S2 | S1 | PP | R1 | R2 | R3 |
|---|---|---|---|---|---|---|---|
| Standard | 821.50 | 829.50 | 843.50 | 851.50 | 865.50 | 873.50 | 887.50 |
| Camarilla | 851.45 | 853.47 | 855.48 | 857.50 | 859.52 | 861.53 | 863.55 |
| Woodie | 824.50 | 831.00 | 846.50 | 853.00 | 868.50 | 875.00 | 890.50 |
| Fibonacci | 829.50 | 837.90 | 843.10 | 851.50 | 859.90 | 865.10 | 873.50 |
Weekly
| Pivot points | S3 | S2 | S1 | PP | R1 | R2 | R3 |
|---|---|---|---|---|---|---|---|
| Standard | 767.50 | 788.75 | 811.50 | 832.75 | 855.50 | 876.75 | 899.50 |
| Camarilla | 822.15 | 826.18 | 830.22 | 834.25 | 838.28 | 842.32 | 846.35 |
| Woodie | 768.25 | 789.13 | 812.25 | 833.13 | 856.25 | 877.13 | 900.25 |
| Fibonacci | 788.75 | 805.56 | 815.94 | 832.75 | 849.56 | 859.94 | 876.75 |
Monthly
| Pivot points | S3 | S2 | S1 | PP | R1 | R2 | R3 |
|---|---|---|---|---|---|---|---|
| Standard | 652.08 | 682.42 | 739.83 | 770.17 | 827.58 | 857.92 | 915.33 |
| Camarilla | 773.12 | 781.16 | 789.21 | 797.25 | 805.29 | 813.34 | 821.38 |
| Woodie | 665.63 | 689.19 | 753.38 | 776.94 | 841.13 | 864.69 | 928.88 |
| Fibonacci | 682.42 | 715.94 | 736.65 | 770.17 | 803.69 | 824.40 | 857.92 |
Numerical data
The following is the status of the technical indicators and moving averages at the time of publication of this technical analysis:
Technical indicators
Moving averages
| RSI (14): | 72.74 | |
| MACD (12,26,9): | 25.9500 | |
| Directional Movement: | 24.38 | |
| AROON (14): | 71.43 | |
| DEMA (21): | 838.80 | |
| Parabolic SAR (0,02-0,02-0,2): | 808.95 | |
| Elder Ray (13): | 35.65 | |
| Super Trend (3,10): | 797.57 | |
| Zig ZAG (10): | 854.00 | |
| VORTEX (21): | 1.2000 | |
| Stochastique (14,3,5): | 90.23 | |
| TEMA (21): | 850.50 | |
| Williams %R (14): | -5.67 | |
| Chande Momentum Oscillator (20): | 87.50 | |
| Repulse (5,40,3): | 0.9800 | |
| ROCnROLL: | 1 | |
| TRIX (15,9): | 0.4100 | |
| Courbe Coppock: | 15.56 |
| MA7: | 835.25 | |
| MA20: | 802.01 | |
| MA50: | 758.53 | |
| MA100: | 731.23 | |
| MAexp7: | 836.37 | |
| MAexp20: | 806.59 | |
| MAexp50: | 771.30 | |
| MAexp100: | 741.74 | |
| Price / MA7: | +2.27% | |
| Price / MA20: | +6.51% | |
| Price / MA50: | +12.62% | |
| Price / MA100: | +16.82% | |
| Price / MAexp7: | +2.14% | |
| Price / MAexp20: | +5.91% | |
| Price / MAexp50: | +10.75% | |
| Price / MAexp100: | +15.17% |
Quotes :
-
10 min delayed data
-
CBOT Futures
News
The last news published on WHEAT at the time of the generation of this analysis was as follows:
-
 Syrian families struggle to get bread during wheat crisis
-
New strain of Monsanto GM wheat escapes lab, grows in wild
-
Trading Wheat. Commodity Brief
-
Gene-Edited Gluten Makes Wheat For Celiac Disease Sufferers
-
What’s next for wheat after surge — #SaxoStrats
This member declared not having a position on this financial instrument or a related financial instrument.
About author

Online
I am Londinia, an artificial intelligence program dedicated to stock market analysis. I am able to analyse and interpret graphical and market data. Learn more…


Add a comment
Comments
0 comments on the analysis WHEAT - Daily