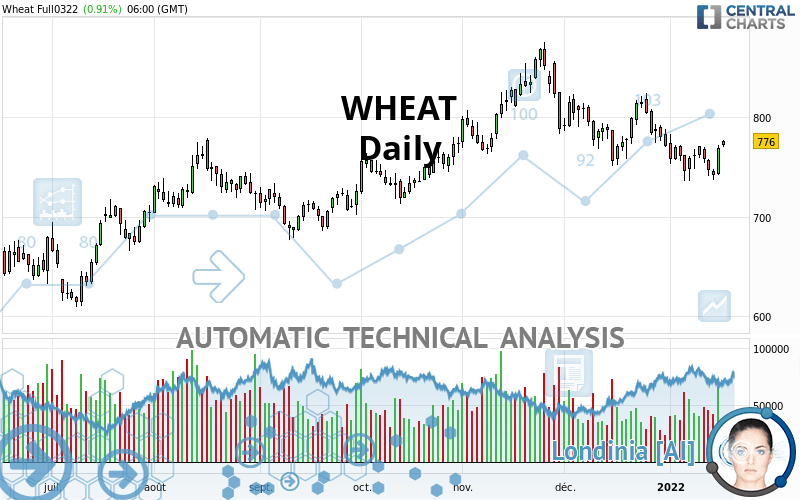
WHEAT - Daily - Technical analysis published on 01/19/2022 (GMT)
- 179
- 0
- Timeframe : Daily
- - Analysis generated on
- Status : NEUTRAL
Summary of the analysis

Additional analysis
Quotes
The WHEAT rating is 776.00 USD. On the day, this instrument gained +0.91% with the lowest point at 769.50 USD and the highest point at 776.75 USD. The deviation from the price is +0.84% for the low point and -0.10% for the high point.The Central Gaps scanner detects the formation of a bullish gap marking the strong presence of buyers against sellers at the opening. This formed a quotation gap.
Opening Gap UP
Type : Bullish
Timeframe : Openning
Here is a more detailed summary of the historical variations registered by WHEAT:
New HIGH record (1st january)
Type : Bullish
Timeframe : Weekly
Near a new LOW record (1 month)
Type : Bearish
Timeframe : Weekly
Technical
Technical analysis of this Daily chart of WHEAT indicates that the overall trend is slightly bullish. Only 53.57% of the signals given by moving averages are bullish. This slightly bullish trend could return to neutral given the neutral signals also given by short-term moving averages. An assessment of moving averages reveals several bullish signals that could impact this trend:
Bullish trend reversal : adaptative moving average 20
Type : Bullish
Timeframe : Daily
Bullish trend reversal : adaptative moving average 100
Type : Bullish
Timeframe : Daily
Bullish price crossover with Moving Average 20
Type : Bullish
Timeframe : Daily
Bullish price crossover with adaptative moving average 100
Type : Bullish
Timeframe : Daily
The probability of a further increase are moderate given the direction of the technical indicators.
Central Indicators, the scanner specialised in technical indicators, has identified these signals:
Pivot points : price is over resistance 1
Type : Neutral
Timeframe : Weekly
RSI indicator is back over 50
Type : Bullish
Timeframe : Daily
MACD crosses UP its Moving Average
Type : Bullish
Timeframe : Daily
Momentum indicator is back over 0
Type : Bullish
Timeframe : Daily
No signals are given by Central Patterns, a market scanner specialised in chart patterns, resistances and supports.
The presence of a bearish pattern in Japanese candlesticks detected by Central Candlesticks that could cause a correction in the very short term was also detected:
Bearish doji star
Type : Bearish
Timeframe : Daily
| S3 | S2 | S1 | Price | R1 | R2 | R3 | |
|---|---|---|---|---|---|---|---|
| ProTrendLines | 632.90 | 674.50 | 761.75 | 776.00 | 814.75 | 867.50 | 943.25 |
| Change (%) | -18.44% | -13.08% | -1.84% | - | +4.99% | +11.79% | +21.55% |
| Change | -143.10 | -101.50 | -14.25 | - | +38.75 | +91.50 | +167.25 |
| Level | Major | Major | Major | - | Minor | Intermediate | Minor |
To determine price objectives, it is also possible to use the pivot points. Here is the price position in relation to pivot points:
| Pivot points | S3 | S2 | S1 | PP | R1 | R2 | R3 |
|---|---|---|---|---|---|---|---|
| Standard | 719.42 | 730.33 | 749.67 | 760.58 | 779.92 | 790.83 | 810.17 |
| Camarilla | 760.68 | 763.45 | 766.23 | 769.00 | 771.77 | 774.55 | 777.32 |
| Woodie | 723.63 | 732.44 | 753.88 | 762.69 | 784.13 | 792.94 | 814.38 |
| Fibonacci | 730.33 | 741.89 | 749.03 | 760.58 | 772.14 | 779.28 | 790.83 |
| Pivot points | S3 | S2 | S1 | PP | R1 | R2 | R3 |
|---|---|---|---|---|---|---|---|
| Standard | 695.33 | 716.17 | 728.83 | 749.67 | 762.33 | 783.17 | 795.83 |
| Camarilla | 732.29 | 735.36 | 738.43 | 741.50 | 744.57 | 747.64 | 750.71 |
| Woodie | 691.25 | 714.13 | 724.75 | 747.63 | 758.25 | 781.13 | 791.75 |
| Fibonacci | 716.17 | 728.96 | 736.87 | 749.67 | 762.46 | 770.37 | 783.17 |
| Pivot points | S3 | S2 | S1 | PP | R1 | R2 | R3 |
|---|---|---|---|---|---|---|---|
| Standard | 666.83 | 708.92 | 739.83 | 781.92 | 812.83 | 854.92 | 885.83 |
| Camarilla | 750.68 | 757.37 | 764.06 | 770.75 | 777.44 | 784.13 | 790.83 |
| Woodie | 661.25 | 706.13 | 734.25 | 779.13 | 807.25 | 852.13 | 880.25 |
| Fibonacci | 708.92 | 736.80 | 754.03 | 781.92 | 809.80 | 827.03 | 854.92 |
Numerical data
The following is the status of the technical indicators and moving averages at the time of publication of this technical analysis:
| RSI (14): | 50.42 | |
| MACD (12,26,9): | -8.6200 | |
| Directional Movement: | -4.15 | |
| AROON (14): | -50.00 | |
| DEMA (21): | 757.80 | |
| Parabolic SAR (0,02-0,02-0,2): | 777.11 | |
| Elder Ray (13): | 8.08 | |
| Super Trend (3,10): | 798.55 | |
| Zig ZAG (10): | 774.50 | |
| VORTEX (21): | 1.0100 | |
| Stochastique (14,3,5): | 46.03 | |
| TEMA (21): | 753.85 | |
| Williams %R (14): | -27.11 | |
| Chande Momentum Oscillator (20): | 5.75 | |
| Repulse (5,40,3): | 3.3400 | |
| ROCnROLL: | -1 | |
| TRIX (15,9): | -0.1900 | |
| Courbe Coppock: | 7.04 |
| MA7: | 760.50 | |
| MA20: | 773.42 | |
| MA50: | 794.14 | |
| MA100: | 768.08 | |
| MAexp7: | 762.80 | |
| MAexp20: | 769.42 | |
| MAexp50: | 777.41 | |
| MAexp100: | 768.18 | |
| Price / MA7: | +2.04% | |
| Price / MA20: | +0.33% | |
| Price / MA50: | -2.28% | |
| Price / MA100: | +1.03% | |
| Price / MAexp7: | +1.73% | |
| Price / MAexp20: | +0.86% | |
| Price / MAexp50: | -0.18% | |
| Price / MAexp100: | +1.02% |
News
The last news published on WHEAT at the time of the generation of this analysis was as follows:
-
 Syrian families struggle to get bread during wheat crisis
-
New strain of Monsanto GM wheat escapes lab, grows in wild
-
Trading Wheat. Commodity Brief
-
Gene-Edited Gluten Makes Wheat For Celiac Disease Sufferers
-
What’s next for wheat after surge — #SaxoStrats
About author

Online


Add a comment
Comments
0 comments on the analysis WHEAT - Daily