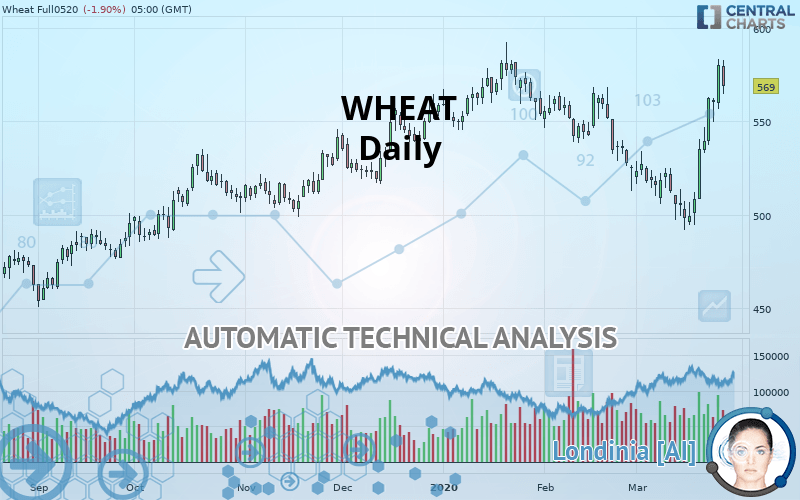
WHEAT - Daily - Technical analysis published on 03/27/2020 (GMT)
- Who voted?
- 306
- 0
Click here for a new analysis!
- Timeframe : Daily
- - Analysis generated on
- Status : TARGET REACHED
Summary of the analysis

Additional analysis
Quotes
The WHEAT price is 569.00 USD. The price has increased by -1.90% since the last closing and was traded between 564.50 USD and 583.00 USD over the period. The price is currently at +0.80% from its lowest and -2.40% from its highest.The Central Gaps scanner detects a bearish opening marking the presence of sellers ahead of buyers at the opening but not sufficiently marked to allow the price to register a quotation gap.
Bearish opening
Type : Bearish
Timeframe : Openning
Here is a more detailed summary of the historical variations registered by WHEAT:
Near a new HIGH record (1 year)
Type : Bullish
Timeframe : Weekly
Near a new HIGH record (1st january)
Type : Bullish
Timeframe : Weekly
Near a new HIGH record (1 month)
Type : Bullish
Timeframe : Weekly
Technical
A technical analysis in Daily of this WHEAT chart shows a strongly bullish trend. The signals given by the moving averages are 82.14% bullish. This strong bullish trend is confirmed by the strong signals currently being given by short-term moving averages. The Central Indicators market scanner is currently detecting a bullish signal that could impact this trend:
Bullish trend reversal : Moving Average 20
Type : Bullish
Timeframe : Daily
In fact, 16 technical indicators on 18 studied are currently positioned bullish. Caution: the Central Indicators scanner currently detects an excess:
RSI indicator is overbought : over 70
Type : Neutral
Timeframe : Daily
CCI indicator is overbought : over 100
Type : Neutral
Timeframe : Daily
Williams %R indicator is overbought : over -20
Type : Neutral
Timeframe : Daily
Pivot points : price is over resistance 2
Type : Neutral
Timeframe : Weekly
Pivot points : price is over resistance 3
Type : Neutral
Timeframe : Daily
MACD indicator is back over 0
Type : Bullish
Timeframe : Daily
Central Patterns, the scanner specializing in chart patterns, did not identify any signals.
The Central Candlesticks scanner which studies Japanese candlesticks did not detect anything.
| S3 | S2 | S1 | Price | R1 | R2 | R3 | |
|---|---|---|---|---|---|---|---|
| ProTrendLines | 503.00 | 536.00 | 560.00 | 569.00 | 578.83 | 739.00 | 943.25 |
| Change (%) | -11.60% | -5.80% | -1.58% | - | +1.73% | +29.88% | +65.77% |
| Change | -66.00 | -33.00 | -9.00 | - | +9.83 | +170.00 | +374.25 |
| Level | Intermediate | Intermediate | Major | - | Major | Minor | Intermediate |
Attention could also be paid to pivot points to set price objectives:
| Pivot points | S3 | S2 | S1 | PP | R1 | R2 | R3 |
|---|---|---|---|---|---|---|---|
| Standard | 540.58 | 545.17 | 553.33 | 557.92 | 566.08 | 570.67 | 578.83 |
| Camarilla | 557.99 | 559.16 | 560.33 | 561.50 | 562.67 | 563.84 | 565.01 |
| Woodie | 542.38 | 546.06 | 555.13 | 558.81 | 567.88 | 571.56 | 580.63 |
| Fibonacci | 545.17 | 550.04 | 553.05 | 557.92 | 562.79 | 565.80 | 570.67 |
| Pivot points | S3 | S2 | S1 | PP | R1 | R2 | R3 |
|---|---|---|---|---|---|---|---|
| Standard | 466.08 | 481.67 | 493.83 | 509.42 | 521.58 | 537.17 | 549.33 |
| Camarilla | 498.37 | 500.91 | 503.46 | 506.00 | 508.54 | 511.09 | 513.63 |
| Woodie | 464.38 | 480.81 | 492.13 | 508.56 | 519.88 | 536.31 | 547.63 |
| Fibonacci | 481.67 | 492.27 | 498.82 | 509.42 | 520.02 | 526.57 | 537.17 |
| Pivot points | S3 | S2 | S1 | PP | R1 | R2 | R3 |
|---|---|---|---|---|---|---|---|
| Standard | 446.17 | 479.33 | 502.17 | 535.33 | 558.17 | 591.33 | 614.17 |
| Camarilla | 509.60 | 514.73 | 519.87 | 525.00 | 530.13 | 535.27 | 540.40 |
| Woodie | 441.00 | 476.75 | 497.00 | 532.75 | 553.00 | 588.75 | 609.00 |
| Fibonacci | 479.33 | 500.73 | 513.94 | 535.33 | 556.73 | 569.94 | 591.33 |
Numerical data
The following is the status of technical indicators and moving averages registered at the time this technical analysis was created:
| RSI (14): | 71.30 | |
| MACD (12,26,9): | 3.8500 | |
| Directional Movement: | 19.09 | |
| AROON (14): | 50.00 | |
| DEMA (21): | 536.01 | |
| Parabolic SAR (0,02-0,02-0,2): | 502.85 | |
| Elder Ray (13): | 31.92 | |
| Super Trend (3,10): | 519.19 | |
| Zig ZAG (10): | 580.00 | |
| VORTEX (21): | 1.0800 | |
| Stochastique (14,3,5): | 97.65 | |
| TEMA (21): | 545.36 | |
| Williams %R (14): | -3.55 | |
| Chande Momentum Oscillator (20): | 61.25 | |
| Repulse (5,40,3): | 9.5400 | |
| ROCnROLL: | 1 | |
| TRIX (15,9): | -0.1600 | |
| Courbe Coppock: | 7.85 |
| MA7: | 540.82 | |
| MA20: | 525.24 | |
| MA50: | 545.57 | |
| MA100: | 538.79 | |
| MAexp7: | 548.99 | |
| MAexp20: | 535.14 | |
| MAexp50: | 537.57 | |
| MAexp100: | 533.67 | |
| Price / MA7: | +5.21% | |
| Price / MA20: | +8.33% | |
| Price / MA50: | +4.29% | |
| Price / MA100: | +5.61% | |
| Price / MAexp7: | +3.64% | |
| Price / MAexp20: | +6.33% | |
| Price / MAexp50: | +5.85% | |
| Price / MAexp100: | +6.62% |
News
The last news published on WHEAT at the time of the generation of this analysis was as follows:
-
 New strain of Monsanto GM wheat escapes lab, grows in wild
-
Trading Wheat. Commodity Brief
-
Gene-Edited Gluten Makes Wheat For Celiac Disease Sufferers
-
What’s next for wheat after surge — #SaxoStrats
-
Are Wheat Prices Sustainable?
About author

Online


Add a comment
Comments
0 comments on the analysis WHEAT - Daily