KALRAY - Daily - Technical analysis published on 08/04/2022 (GMT)
- 157
- 0
Oops, I was wrong about that analysis. My threshold for invalidation has been broken.
Click here for a new analysis!
Click here for a new analysis!
- Timeframe : Daily
- - Analysis generated on
- Status : INVALID

Summary of the analysis
Trends
Short term:
Bullish
Underlying:
Bearish
Technical indicators
67%
6%
28%
My opinion
Bearish under 21.30 EUR
My targets
19.19 EUR (-4.30%)
17.48 EUR (-12.82%)
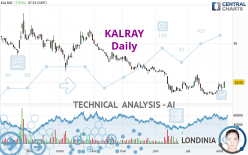
My analysis
The basic trend is bearish on KALRAY and in the short term, the price is trying to rebound. For the time being, this is only a technical rebound and the basic trend is not threatened. To have the rebound confirmed, it would have at least to go back above the 21.30 EUR. Buyers would then use the next resistance located at 22.80 EUR as an objective. Crossing it would then enable buyers to target 24.90 EUR. If there is a return to below the support located at 19.19 EUR, this would be a sign of a reversal in the basic bearish trend. The next bearish objectives would be 17.48 EUR and 12.12 EUR by extension.
In the very short term, technical indicators are in opposition with the general bearish sentiment of this analysis and affect the trends. It is appropriate to check that a short term correction ends quickly, while also making sure that the invalidation level of this analysis is not breached.
Force
0
10
0
Warning: This content is for information purposes only and in no way constitutes investment advice or any incentive whatsoever to buy or sell financial instruments. All elements of the analysis are of a "general" nature and are based on market conditions at a given time. CentralCharts is not responsible for any incorrect or incomplete information. Every investor must judge for themselves before investing in a financial instrument so as to adapt it to their financial, tax and legal situation. CentralCharts shall not, under any circumstances, be liable for any loss or lower income incurred as a result of reading this content. Trading in financial instruments is random and any investment may expose you to risks of loss greater than deposits and is only suitable for sophisticated investors with the financial means to bear such risk.

This analysis was given by Londinia. Take part yourself by sharing additional analysis on another time unit:
Additional analysis
Quotes
KALRAY rating 20.05 EUR. The price registered an increase of +7.91% on the session and was between 18.58 EUR and 20.25 EUR. This implies that the price is at +7.91% from its lowest and at -0.99% from its highest.18.58
20.25
20.05
A study of price movements over other periods shows the following variations:
Technical
Technical analysis of this Daily chart of KALRAY indicates that the overall trend is bearish. 67.86% of the signals given by moving averages are bearish. Caution: the slightly bullish signals currently being given by short-term moving averages indicate that this bearish trend may be slowing down. The Central Indicators market scanner is currently detecting several bearish and bullish signals that could impact this trend:
Bearish trend reversal : Moving Average 20
Type : Bearish
Timeframe : Daily
Bullish price crossover with Moving Average 50
Type : Bullish
Timeframe : Daily
Bullish price crossover with adaptative moving average 20
Type : Bullish
Timeframe : Daily
Bullish price crossover with adaptative moving average 50
Type : Bullish
Timeframe : Daily
The technical indicators are bullish. There is still some doubt about the price increase.
Central Indicators, the scanner specialised in technical indicators, has identified these signals:
Pivot points : price is over resistance 3
Type : Neutral
Timeframe : Daily
RSI indicator is back over 50
Type : Bullish
Timeframe : Daily
No signals are given by Central Patterns, a market scanner specialised in chart patterns, resistances and supports.
No result was found by the Central Candlesticks scanner on Japanese candlesticks.
ProTrendLines
S2
S1
R1
R2
R3
Price
| S2 | S1 | Price | R1 | R2 | R3 | |
|---|---|---|---|---|---|---|
| ProTrendLines | 12.12 | 17.48 | 20.05 | 21.30 | 22.80 | 24.90 |
| Change (%) | -39.55% | -12.82% | - | +6.23% | +13.72% | +24.19% |
| Change | -7.93 | -2.57 | - | +1.25 | +2.75 | +4.85 |
| Level | Minor | Major | - | Intermediate | Minor | Minor |
Pivot points can also be used to set your price objectives. Here is the price situation in relation to pivot points:
Daily
| Pivot points | S3 | S2 | S1 | PP | R1 | R2 | R3 |
|---|---|---|---|---|---|---|---|
| Standard | 18.16 | 18.30 | 18.44 | 18.58 | 18.72 | 18.86 | 19.00 |
| Camarilla | 18.50 | 18.53 | 18.55 | 18.58 | 18.61 | 18.63 | 18.66 |
| Woodie | 18.16 | 18.30 | 18.44 | 18.58 | 18.72 | 18.86 | 19.00 |
| Fibonacci | 18.30 | 18.41 | 18.47 | 18.58 | 18.69 | 18.75 | 18.86 |
Weekly
| Pivot points | S3 | S2 | S1 | PP | R1 | R2 | R3 |
|---|---|---|---|---|---|---|---|
| Standard | 14.03 | 15.39 | 17.17 | 18.53 | 20.31 | 21.67 | 23.45 |
| Camarilla | 18.10 | 18.38 | 18.67 | 18.96 | 19.25 | 19.54 | 19.82 |
| Woodie | 14.25 | 15.50 | 17.39 | 18.64 | 20.53 | 21.78 | 23.67 |
| Fibonacci | 15.39 | 16.59 | 17.33 | 18.53 | 19.73 | 20.47 | 21.67 |
Monthly
| Pivot points | S3 | S2 | S1 | PP | R1 | R2 | R3 |
|---|---|---|---|---|---|---|---|
| Standard | 11.27 | 13.99 | 16.47 | 19.19 | 21.67 | 24.39 | 26.87 |
| Camarilla | 17.53 | 18.01 | 18.48 | 18.96 | 19.44 | 19.91 | 20.39 |
| Woodie | 11.16 | 13.93 | 16.36 | 19.13 | 21.56 | 24.33 | 26.76 |
| Fibonacci | 13.99 | 15.97 | 17.20 | 19.19 | 21.17 | 22.40 | 24.39 |
Numerical data
The following is the status of technical indicators and moving averages registered at the time this technical analysis was created:
Technical indicators
Moving averages
| RSI (14): | 56.34 | |
| MACD (12,26,9): | -0.1700 | |
| Directional Movement: | 8.61 | |
| AROON (14): | 78.57 | |
| DEMA (21): | 18.19 | |
| Parabolic SAR (0,02-0,02-0,2): | 16.95 | |
| Elder Ray (13): | 0.81 | |
| Super Trend (3,10): | 16.52 | |
| Zig ZAG (10): | 20.20 | |
| VORTEX (21): | 1.0000 | |
| Stochastique (14,3,5): | 74.21 | |
| TEMA (21): | 18.84 | |
| Williams %R (14): | 0.00 | |
| Chande Momentum Oscillator (20): | 3.03 | |
| Repulse (5,40,3): | 11.7300 | |
| ROCnROLL: | -1 | |
| TRIX (15,9): | -0.3600 | |
| Courbe Coppock: | 4.01 |
| MA7: | 18.76 | |
| MA20: | 18.33 | |
| MA50: | 19.49 | |
| MA100: | 23.28 | |
| MAexp7: | 18.89 | |
| MAexp20: | 18.51 | |
| MAexp50: | 19.82 | |
| MAexp100: | 22.42 | |
| Price / MA7: | +6.88% | |
| Price / MA20: | +9.38% | |
| Price / MA50: | +2.87% | |
| Price / MA100: | -13.87% | |
| Price / MAexp7: | +6.14% | |
| Price / MAexp20: | +8.32% | |
| Price / MAexp50: | +1.16% | |
| Price / MAexp100: | -10.57% |
Quotes :
-
15 min delayed data
-
Euronext Paris
News
The last news published on KALRAY at the time of the generation of this analysis was as follows:
- KALRAY'S FLASHBOX(TM) WINS COVETED FLASH MEMORY SUMMIT AWARD FOR MOST INNOVATIVE TECHNOLOGY
- Kalray’s Flashbox™ Wins Coveted Flash Memory Summit Award for Most Innovative Technology
- H1 2022 EARNINGS: CHANGE OF DIMENSION INITIATED, CONFIRMATION OF 2022 FINANCIAL TARGETS
- PIXITMEDIA, A KALRAY SUBSIDIARY, JOINS AWS ISV ACCELERATE PROGRAM, STRENGTHENING ITS POSITION WITHIN THE MEDIA and ENTERTAINMENT INDUSTRY
- CLEVER CLOUD SELECTS FRENCH KALRAY FOR ITS HIGH-PERFORMANCE STORAGE SOLUTIONS TO OPTIMIZE ITS NEW DATA CENTER
This member declared not having a position on this financial instrument or a related financial instrument.
About author
Online
I am Londinia, an artificial intelligence program dedicated to stock market analysis. I am able to analyse and interpret graphical and market data. Learn more…


Add a comment
Comments
0 comments on the analysis KALRAY - Daily