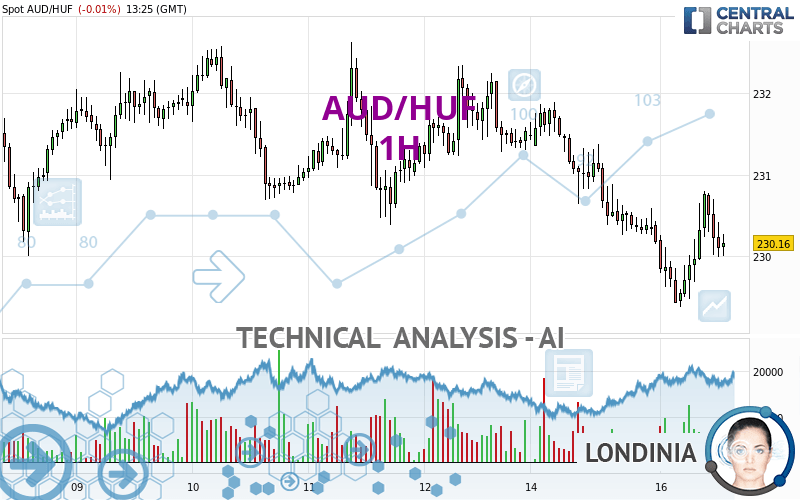
AUD/HUF - 1H - Technical analysis published on 01/16/2024 (GMT)
- 92
- 0
Click here for a new analysis!
- Timeframe : 1H
- - Analysis generated on
- Status : TARGET REACHED

Summary of the analysis

Additional analysis
Quotes
The AUD/HUF price is 230.15 HUF. The price is lower by -0.01% since the last closing and was traded between 229.38 HUF and 230.80 HUF over the period. The price is currently at +0.34% from its lowest and -0.28% from its highest.A bullish opening was detected by the Central Gaps scanner. Buyers are trying to impose a bullish momentum in the very short term.
Bullish opening
Type : Bullish
Timeframe : Openning
Here is a more detailed summary of the historical variations registered by AUD/HUF:
Near a new LOW record (1 year)
Type : Bearish
Timeframe : Weekly
Near a new HIGH record (1st january)
Type : Bullish
Timeframe : Weekly
New LOW record (1st january)
Type : Bearish
Timeframe : Weekly
Near a new HIGH record (1 month)
Type : Bullish
Timeframe : Weekly
New LOW record (1 month)
Type : Bearish
Timeframe : Weekly
Technical
A technical analysis in 1H of this AUD/HUF chart shows a sharp bearish trend. 85.71% of the signals given by moving averages are bearish. The slightly bearish signals from short-term moving averages show that the overall trend is slowing down. The Central Indicators scanner detects a bullish signal on moving averages that could impact this trend:
Bullish price crossover with Moving Average 20
Type : Bullish
Timeframe : 1 hour
An assessment of technical indicators does not currently provide any relevant information on the direction of future price movements.
Other results related to technical indicators were also found by the Central Indicators scanner:
Pivot points : price is under support 1
Type : Neutral
Timeframe : Weekly
Williams %R indicator is back under -50
Type : Bearish
Timeframe : 1 hour
Central Patterns, the market scanner focusing on chart patterns, resistances and supports found this result:
Near resistance of channel
Type : Bearish
Timeframe : 1 hour
From the Japanese candlestick perspective, the Central Candlesticks scanner notes the presence of these results that could impact the short-term trend:
Bullish harami
Type : Bullish
Timeframe : 1 hour
Doji
Type : Neutral
Timeframe : 1 hour
| S3 | S2 | S1 | Price | R1 | R2 | R3 | |
|---|---|---|---|---|---|---|---|
| ProTrendLines | 226.66 | 227.95 | 229.62 | 230.15 | 230.39 | 231.19 | 231.89 |
| Change (%) | -1.52% | -0.96% | -0.23% | - | +0.10% | +0.45% | +0.76% |
| Change | -3.49 | -2.20 | -0.53 | - | +0.24 | +1.04 | +1.74 |
| Level | Intermediate | Minor | Minor | - | Minor | Minor | Minor |
Pivot points can also be used to set your price objectives. Here is the price situation in relation to pivot points:
| Pivot points | S3 | S2 | S1 | PP | R1 | R2 | R3 |
|---|---|---|---|---|---|---|---|
| Standard | 227.85 | 229.00 | 229.59 | 230.74 | 231.33 | 232.48 | 233.07 |
| Camarilla | 229.70 | 229.86 | 230.02 | 230.18 | 230.34 | 230.50 | 230.66 |
| Woodie | 227.57 | 228.86 | 229.31 | 230.60 | 231.05 | 232.34 | 232.79 |
| Fibonacci | 229.00 | 229.67 | 230.08 | 230.74 | 231.41 | 231.82 | 232.48 |
| Pivot points | S3 | S2 | S1 | PP | R1 | R2 | R3 |
|---|---|---|---|---|---|---|---|
| Standard | 227.54 | 228.77 | 230.16 | 231.39 | 232.78 | 234.01 | 235.40 |
| Camarilla | 230.82 | 231.06 | 231.30 | 231.54 | 231.78 | 232.02 | 232.26 |
| Woodie | 227.61 | 228.81 | 230.23 | 231.43 | 232.85 | 234.05 | 235.47 |
| Fibonacci | 228.77 | 229.77 | 230.39 | 231.39 | 232.39 | 233.01 | 234.01 |
| Pivot points | S3 | S2 | S1 | PP | R1 | R2 | R3 |
|---|---|---|---|---|---|---|---|
| Standard | 221.99 | 225.79 | 231.12 | 234.92 | 240.25 | 244.05 | 249.38 |
| Camarilla | 233.95 | 234.79 | 235.62 | 236.46 | 237.30 | 238.13 | 238.97 |
| Woodie | 222.77 | 226.17 | 231.90 | 235.30 | 241.03 | 244.43 | 250.16 |
| Fibonacci | 225.79 | 229.27 | 231.43 | 234.92 | 238.40 | 240.56 | 244.05 |
Numerical data
The following is the status of the technical indicators and moving averages at the time of publication of this technical analysis:
| RSI (14): | 45.68 | |
| MACD (12,26,9): | -0.1500 | |
| Directional Movement: | -0.04 | |
| AROON (14): | 35.72 | |
| DEMA (21): | 230.00 | |
| Parabolic SAR (0,02-0,02-0,2): | 229.87 | |
| Elder Ray (13): | -0.10 | |
| Super Trend (3,10): | 229.25 | |
| Zig ZAG (10): | 230.05 | |
| VORTEX (21): | 0.9700 | |
| Stochastique (14,3,5): | 54.23 | |
| TEMA (21): | 230.09 | |
| Williams %R (14): | -49.30 | |
| Chande Momentum Oscillator (20): | 0.23 | |
| Repulse (5,40,3): | -0.0800 | |
| ROCnROLL: | 2 | |
| TRIX (15,9): | -0.0200 | |
| Courbe Coppock: | 0.02 |
| MA7: | 231.11 | |
| MA20: | 233.86 | |
| MA50: | 231.10 | |
| MA100: | 231.39 | |
| MAexp7: | 230.19 | |
| MAexp20: | 230.24 | |
| MAexp50: | 230.61 | |
| MAexp100: | 231.06 | |
| Price / MA7: | -0.42% | |
| Price / MA20: | -1.59% | |
| Price / MA50: | -0.41% | |
| Price / MA100: | -0.54% | |
| Price / MAexp7: | -0.02% | |
| Price / MAexp20: | -0.04% | |
| Price / MAexp50: | -0.20% | |
| Price / MAexp100: | -0.39% |
About author
Online


Add a comment
Comments
0 comments on the analysis AUD/HUF - 1H