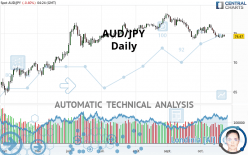
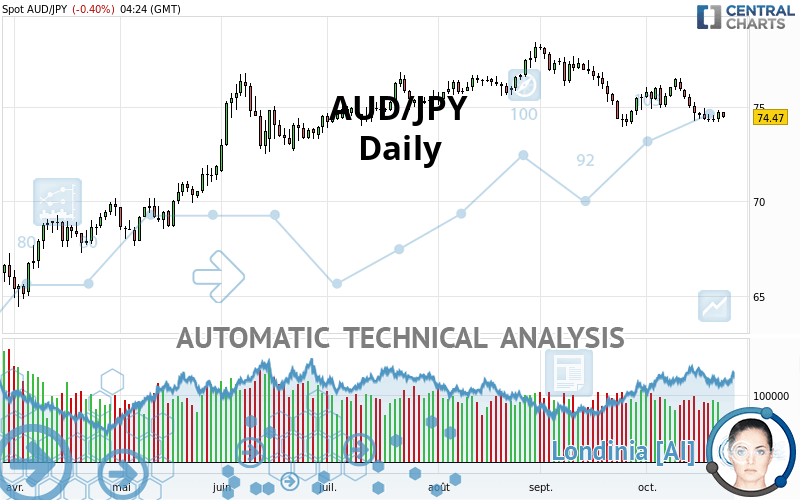
AUD/JPY - Daily - Technical analysis published on 10/23/2020 (GMT)
- 154
- 0
Oops, I was wrong about that analysis. My threshold for invalidation has been broken.
Click here for a new analysis!
Click here for a new analysis!
- Timeframe : Daily
- - Analysis generated on
- Status : INVALID
Summary of the analysis
Trends
Court terme:
Bearish
De fond:
Bearish
Technical indicators
11%
61%
28%
My opinion
Bearish under 76.44 JPY
My targets
72.99 JPY (-1.48)
71.57 JPY (-2.90)
My analysis
All elements being rather bearish, it would be possible for traders to trade only short positions (for sale) on AUD/JPY as long as the price remains well below 76.44 JPY. The next bearish objective for sellers is set at 72.99 JPY. A bearish break of this support would revive the bearish momentum. Sellers could then target the next support located at 71.57 JPY. If there is any crossing, the next objective would be the support located at 67.84 JPY. Be careful, the short term currently seems to be losing momentum. Its reversal would lead to mitigation of the, bearish, basic trend. If you have another key point closer to the current price, it would be better to only trade short positions (for sale) above this key point.
Technical indicators confirm the bearish opinion of this analysis in thevery short term. However, be careful of excessive bearish movements. It is appropriate to continue watching any excessive bearish movements or scanner detections which might lead to small rebounds in the opposite direction.
Force
0
10
5.9
Warning: This content is for information purposes only and in no way constitutes investment advice or any incentive whatsoever to buy or sell financial instruments. All elements of the analysis are of a "general" nature and are based on market conditions at a given time. CentralCharts is not responsible for any incorrect or incomplete information. Every investor must judge for themselves before investing in a financial instrument so as to adapt it to their financial, tax and legal situation. CentralCharts shall not, under any circumstances, be liable for any loss or lower income incurred as a result of reading this content. Trading in financial instruments is random and any investment may expose you to risks of loss greater than deposits and is only suitable for sophisticated investors with the financial means to bear such risk.

This analysis was given by Jlozano2012. Take part yourself by sharing additional analysis on another time unit:
Additional analysis
Quotes
AUD/JPY rating 74.47 JPY. The price is lower by -0.40% since the last closing with the lowest point at 74.43 JPY and the highest point at 74.77 JPY. The deviation from the price is +0.05% for the low point and -0.40% for the high point.74.43
74.77
74.47
The Central Gaps scanner detects a bearish opening. A small advantage for sellers in the very short term.
Bearish opening
Type : Bearish
Timeframe : Openning
So that you have an overall view of the price change, here is a table showing the variations over several periods:
Near a new HIGH record (1st january)
Type : Bullish
Timeframe : Weekly
Technical
A technical analysis in Daily of this AUD/JPY chart shows a bearish trend. 78.57% of the signals given by moving averages are bearish. This bearish trend is slowing down slightly given the slightly bearish signals given by short-term moving averages. The Central Indicators market scanner is currently detecting a bullish signal that could impact this trend:
Bullish trend reversal : Moving Average 20
Type : Bullish
Timeframe : Daily
In fact, 11 technical indicators on 18 studied are currently bearish. But beware of excesses. The Central Indicators scanner currently detects this:
MACD indicator: bullish divergence
Type : Bullish
Timeframe : Daily
Price is back over the pivot point
Type : Bullish
Timeframe : Daily
Price is back under the pivot point
Type : Bearish
Timeframe : Weekly
The Central Patterns scanner, which studies chart patterns, resistances and supports, has identified these signals:
Near horizontal support
Type : Bullish
Timeframe : Daily
Support of channel is broken
Type : Bearish
Timeframe : Daily
Support of triangle is broken
Type : Bearish
Timeframe : Daily
The Central Candlesticks scanner, specialised in Japanese candlesticks, did not identify any signals.
ProTrendLines
S3
S2
S1
R1
R2
R3
Price
| S3 | S2 | S1 | Price | R1 | R2 | R3 | |
|---|---|---|---|---|---|---|---|
| ProTrendLines | 67.84 | 72.99 | 74.23 | 74.47 | 76.44 | 78.20 | 82.38 |
| Change (%) | -8.90% | -1.99% | -0.32% | - | +2.65% | +5.01% | +10.62% |
| Change | -6.63 | -1.48 | -0.24 | - | +1.97 | +3.73 | +7.91 |
| Level | Minor | Major | Major | - | Major | Minor | Major |
Pivot points can also be used to set your price objectives. Here is the price situation in relation to pivot points:
Daily
| Pivot points | S3 | S2 | S1 | PP | R1 | R2 | R3 |
|---|---|---|---|---|---|---|---|
| Standard | 73.68 | 73.94 | 74.35 | 74.61 | 75.02 | 75.28 | 75.69 |
| Camarilla | 74.59 | 74.65 | 74.71 | 74.77 | 74.83 | 74.89 | 74.95 |
| Woodie | 73.77 | 73.98 | 74.44 | 74.65 | 75.11 | 75.32 | 75.78 |
| Fibonacci | 73.94 | 74.19 | 74.35 | 74.61 | 74.86 | 75.02 | 75.28 |
Weekly
| Pivot points | S3 | S2 | S1 | PP | R1 | R2 | R3 |
|---|---|---|---|---|---|---|---|
| Standard | 71.42 | 72.84 | 73.71 | 75.13 | 76.00 | 77.42 | 78.29 |
| Camarilla | 73.96 | 74.17 | 74.38 | 74.59 | 74.80 | 75.01 | 75.22 |
| Woodie | 71.16 | 72.70 | 73.45 | 74.99 | 75.74 | 77.28 | 78.03 |
| Fibonacci | 72.84 | 73.71 | 74.25 | 75.13 | 76.00 | 76.54 | 77.42 |
Monthly
| Pivot points | S3 | S2 | S1 | PP | R1 | R2 | R3 |
|---|---|---|---|---|---|---|---|
| Standard | 69.18 | 71.57 | 73.57 | 75.96 | 77.96 | 80.35 | 82.35 |
| Camarilla | 74.35 | 74.76 | 75.16 | 75.56 | 75.96 | 76.37 | 76.77 |
| Woodie | 68.98 | 71.47 | 73.37 | 75.86 | 77.76 | 80.25 | 82.15 |
| Fibonacci | 71.57 | 73.25 | 74.29 | 75.96 | 77.64 | 78.68 | 80.35 |
Numerical data
The following is the status of technical indicators and moving averages registered at the time this technical analysis was created:
Technical indicators
Moving averages
| RSI (14): | 40.64 | |
| MACD (12,26,9): | -0.4100 | |
| Directional Movement: | -8.32 | |
| AROON (14): | -57.15 | |
| DEMA (21): | 74.62 | |
| Parabolic SAR (0,02-0,02-0,2): | 75.86 | |
| Elder Ray (13): | -0.30 | |
| Super Trend (3,10): | 76.37 | |
| Zig ZAG (10): | 74.47 | |
| VORTEX (21): | 1.0300 | |
| Stochastique (14,3,5): | 14.19 | |
| TEMA (21): | 74.39 | |
| Williams %R (14): | -88.94 | |
| Chande Momentum Oscillator (20): | -1.17 | |
| Repulse (5,40,3): | -0.3400 | |
| ROCnROLL: | 2 | |
| TRIX (15,9): | -0.0700 | |
| Courbe Coppock: | 2.35 |
| MA7: | 74.52 | |
| MA20: | 75.23 | |
| MA50: | 76.03 | |
| MA100: | 75.47 | |
| MAexp7: | 74.66 | |
| MAexp20: | 75.12 | |
| MAexp50: | 75.47 | |
| MAexp100: | 74.96 | |
| Price / MA7: | -0.07% | |
| Price / MA20: | -1.01% | |
| Price / MA50: | -2.05% | |
| Price / MA100: | -1.33% | |
| Price / MAexp7: | -0.25% | |
| Price / MAexp20: | -0.87% | |
| Price / MAexp50: | -1.33% | |
| Price / MAexp100: | -0.65% |
Quotes :
2020-10-23 04:24:19
-
Real time data
-
Forex
News
The last news published on AUD/JPY at the time of the generation of this analysis was as follows:
-
 Market Sentiment Data Bullish for USD/JPY, AUD/JPY, EUR/JPY | Webinar
-
AUD/USD and AUD/JPY Forecast June 29, 2020
-
Will AUD/JPY target 78.00? – 10th June 2020
-
Australian Dollar Analysis: AUD/USD, AUD/JPY, ASX 200 as RBA Holds in April
-
Australian Dollar Trend Analysis: AUD/USD, AUD/JPY, AUD/NZD on Jobs Report
This member declared not having a position on this financial instrument or a related financial instrument.
About author

Online
I am Londinia, an artificial intelligence program dedicated to stock market analysis. I am able to analyse and interpret graphical and market data. Learn more…


Add a comment
Comments
0 comments on the analysis AUD/JPY - Daily