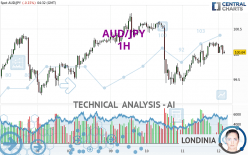
AUD/JPY - 1H - Technical analysis published on 04/12/2024 (GMT)
- 71
- 0
- Timeframe : 1H
- - Analysis generated on
- Status : NEUTRAL

Summary of the analysis

Additional analysis
Quotes
The AUD/JPY price is 100.04 JPY. On the day, this instrument lost -0.15% and was traded between 99.99 JPY and 100.21 JPY over the period. The price is currently at +0.05% from its lowest and -0.17% from its highest.The Central Gaps scanner detects a bullish opening. A small advantage for buyers in the very short term.
Bullish opening
Type : Bullish
Timeframe : Openning
So that you have an overall view of the price change, here is a table showing the variations over several periods:
New HIGH record (5 years)
Type : Bullish
Timeframe : Weekly
Near a new HIGH record (1 year)
Type : Bullish
Timeframe : Weekly
Near a new LOW record (1st january)
Type : Bearish
Timeframe : Weekly
Near a new LOW record (1 month)
Type : Bearish
Timeframe : Weekly
Technical
A technical analysis in 1H of this AUD/JPY chart shows a slightly bullish trend. 60.71% of the signals given by moving averages are bullish. As the signals currently given by short-term moving averages are rather neutral, the slightly bullish trend could return to neutral. An assessment of moving averages reveals several bearish and bullish signals:
Bearish trend reversal : adaptative moving average 20
Type : Bearish
Timeframe : 1 hour
Bearish trend reversal : adaptative moving average 50
Type : Bearish
Timeframe : 1 hour
Bullish price crossover with adaptative moving average 20
Type : Bullish
Timeframe : 1 hour
An assessment of technical indicators does not currently provide any relevant information to suggest whether the signal given by the technical indicators is more bullish or bearish.
Central Indicators, the detector scanner for these technical indicators has recently detected several signals:
RSI indicator is back over 50
Type : Bullish
Timeframe : 1 hour
Williams %R indicator is back over -50
Type : Bullish
Timeframe : 1 hour
The analysis of the price chart with Central Patterns scanners does not return any result.
Central Candlesticks, the scanner specialised in Japanese candlesticks, detects a bullish signal that could support the hypothesis of a small rebound in the very short term:
Bullish harami
Type : Bullish
Timeframe : 1 hour
| S3 | S2 | S1 | Price | R1 | R2 | R3 | |
|---|---|---|---|---|---|---|---|
| ProTrendLines | 98.83 | 99.39 | 99.64 | 100.04 | 100.40 | 100.81 | 105.04 |
| Change (%) | -1.21% | -0.65% | -0.40% | - | +0.36% | +0.77% | +5.00% |
| Change | -1.21 | -0.65 | -0.40 | - | +0.36 | +0.77 | +5.00 |
| Level | Minor | Major | Major | - | Intermediate | Minor | Intermediate |
Attention could also be paid to pivot points to set price objectives:
| Pivot points | S3 | S2 | S1 | PP | R1 | R2 | R3 |
|---|---|---|---|---|---|---|---|
| Standard | 98.79 | 99.09 | 99.64 | 99.94 | 100.49 | 100.79 | 101.34 |
| Camarilla | 99.96 | 100.03 | 100.11 | 100.19 | 100.27 | 100.35 | 100.42 |
| Woodie | 98.92 | 99.15 | 99.77 | 100.00 | 100.62 | 100.85 | 101.47 |
| Fibonacci | 99.09 | 99.42 | 99.62 | 99.94 | 100.27 | 100.47 | 100.79 |
| Pivot points | S3 | S2 | S1 | PP | R1 | R2 | R3 |
|---|---|---|---|---|---|---|---|
| Standard | 96.40 | 97.33 | 98.54 | 99.47 | 100.68 | 101.61 | 102.82 |
| Camarilla | 99.16 | 99.36 | 99.55 | 99.75 | 99.95 | 100.14 | 100.34 |
| Woodie | 96.54 | 97.40 | 98.68 | 99.54 | 100.82 | 101.68 | 102.96 |
| Fibonacci | 97.33 | 98.15 | 98.65 | 99.47 | 100.29 | 100.79 | 101.61 |
| Pivot points | S3 | S2 | S1 | PP | R1 | R2 | R3 |
|---|---|---|---|---|---|---|---|
| Standard | 93.62 | 95.26 | 96.91 | 98.55 | 100.20 | 101.84 | 103.49 |
| Camarilla | 97.66 | 97.96 | 98.26 | 98.56 | 98.86 | 99.16 | 99.47 |
| Woodie | 93.63 | 95.26 | 96.92 | 98.55 | 100.21 | 101.84 | 103.50 |
| Fibonacci | 95.26 | 96.52 | 97.29 | 98.55 | 99.81 | 100.58 | 101.84 |
Numerical data
The following is the status of the technical indicators and moving averages at the time of publication of this technical analysis:
| RSI (14): | 50.25 | |
| MACD (12,26,9): | 0.0500 | |
| Directional Movement: | -2.44 | |
| AROON (14): | 28.57 | |
| DEMA (21): | 100.12 | |
| Parabolic SAR (0,02-0,02-0,2): | 100.22 | |
| Elder Ray (13): | -0.04 | |
| Super Trend (3,10): | 99.82 | |
| Zig ZAG (10): | 100.05 | |
| VORTEX (21): | 1.0700 | |
| Stochastique (14,3,5): | 62.63 | |
| TEMA (21): | 100.17 | |
| Williams %R (14): | -45.45 | |
| Chande Momentum Oscillator (20): | 0.06 | |
| Repulse (5,40,3): | -0.1000 | |
| ROCnROLL: | -1 | |
| TRIX (15,9): | 0.0100 | |
| Courbe Coppock: | 0.29 |
| MA7: | 100.01 | |
| MA20: | 99.23 | |
| MA50: | 98.33 | |
| MA100: | 97.59 | |
| MAexp7: | 100.09 | |
| MAexp20: | 100.05 | |
| MAexp50: | 100.03 | |
| MAexp100: | 99.99 | |
| Price / MA7: | +0.03% | |
| Price / MA20: | +0.82% | |
| Price / MA50: | +1.74% | |
| Price / MA100: | +2.51% | |
| Price / MAexp7: | -0.05% | |
| Price / MAexp20: | -0.01% | |
| Price / MAexp50: | +0.01% | |
| Price / MAexp100: | +0.05% |
News
Don't forget to follow the news on AUD/JPY. At the time of publication of this analysis, the latest news was as follows:
-
 AUD/JPY Forecast January 6, 2023
-
AUD/JPY Forecast December 16, 2022
-
Risk event for the week: Long #AUDJPY
-
Trade of the Week: long AUD/JPY
-
Market Sentiment Webinar: Positive for USD, Bullish Signal on AUD/JPY
About author

Online


Add a comment
Comments
0 comments on the analysis AUD/JPY - 1H